
-
Bitcoin's price has surged significantly since September 7, breaking above the crucial $65,000 level.
-
Cryptocurrency expert Miles Deutscher suggests a cautious approach, emphasizing the importance of the $65,000 level.
-
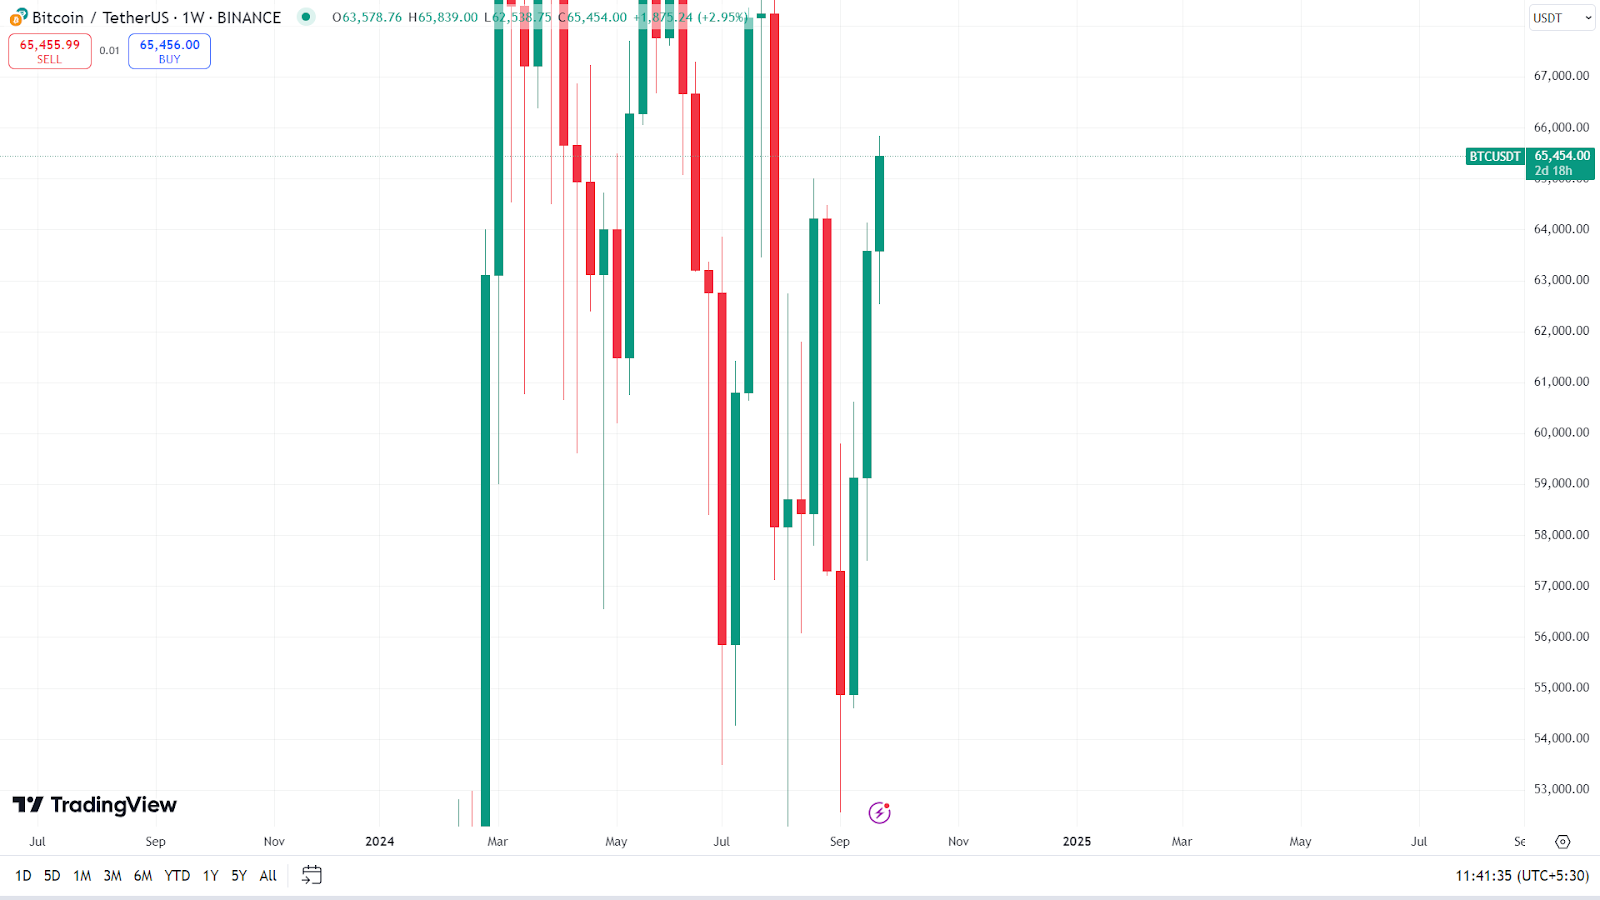
The weekly chart of Bitcoin shows strong bullish momentum, indicating a potential new uptrend if the $65,000 level is maintained.
The Bitcoin market met a strong upward momentum on September 7. Since then, the momentum has been gradually picking up strength. Yesterday, it helped the market break above the crucial range of $65,000. Now, the $BTC price stands at $65,254. Can we confirm that a new bull run has begun?
Cryptocurrency expert Miles Deutscher has something to share about this new accomplishment of Bitcoin. Don’t miss out on these insights.
Bitcoin Market Analysis for September 2024
At the start of the month, Bitcoin was trading at $57,326, and the market was mostly bearish. Between September 3 and 6, the price dropped sharply from $59,123 to $53,985, marking the biggest drop so far this month. But things turned around on September 7, as buyers stepped in and pushed the market into a bullish trend. Despite a few dips, such as between September 14 and 16 when $BTC slipped from $60,443 to $58,253, the market has stayed mostly positive.
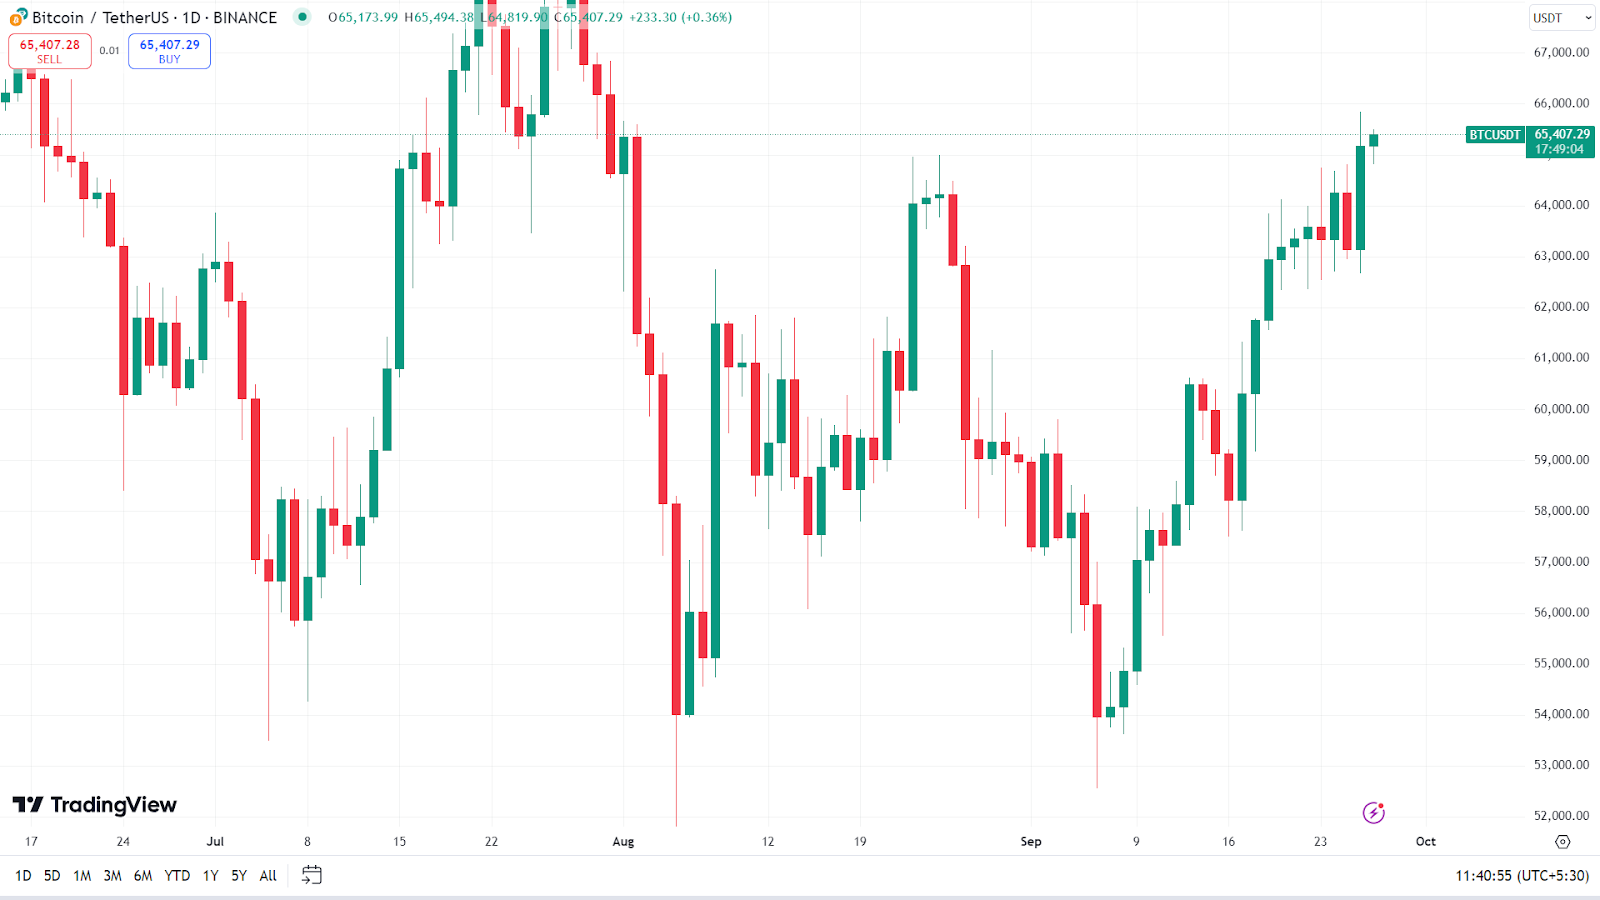
Deutscher notes that Bitcoin’s break above $65,000 is significant because it created a “higher high,” which is usually a sign of a strong bullish trend.
First $BTC daily close above the "must hold" level at $65k (and a higher high).
— Miles Deutscher (@milesdeutscher) September 27, 2024
Final thing I want to see is a weekly close above for additional confirmation (3 days to go).
The new uptrend may officially be confirmed! pic.twitter.com/FJWwvoYeyL
However, Deutscher advises caution. While $65,000 is an important level, he suggests waiting for confirmation. If Bitcoin can hold above this level on the weekly chart, it could confirm a longer-term uptrend.
Weekly Chart Shows Bullish Signs
Looking at the weekly chart, Bitcoin has shown strength with three consecutive bullish candlesticks. The only bearish week was the first of the month when the price dropped to $54,855. After that, the second week saw a rise to $59,123, and the third week reached a high of $63,588. If this trend continues, Bitcoin could follow the same upward momentum seen earlier in the month.
The $65,000 level is critical for Bitcoin’s future. As Deutscher suggests, it’s important to watch the market over the next few days to see if Bitcoin can stay above this level. If it does, it could signal the start of a new bull run.