
Bitcoin is currently trading at $63,554, following a fluctuating 24-hour range between $62,479 and $64,687. Key technical indicators show mixed signals, with consolidation after recent resistance at $64,730. Traders are watching closely for potential entry points as market indecision sets in across multiple timeframes.
Bitcoin
On the 1-hour chart, bitcoin (BTC) shows signs of cooling off after reaching the key resistance level of $64,730. Price action has been largely sideways since, consolidating around $63,500. The rejection from $64,730, coupled with declining volume, signals a possible weakening of bullish momentum. Traders should watch for potential support at $62,500, which could offer a short-term entry point if confirmed by volume spikes.
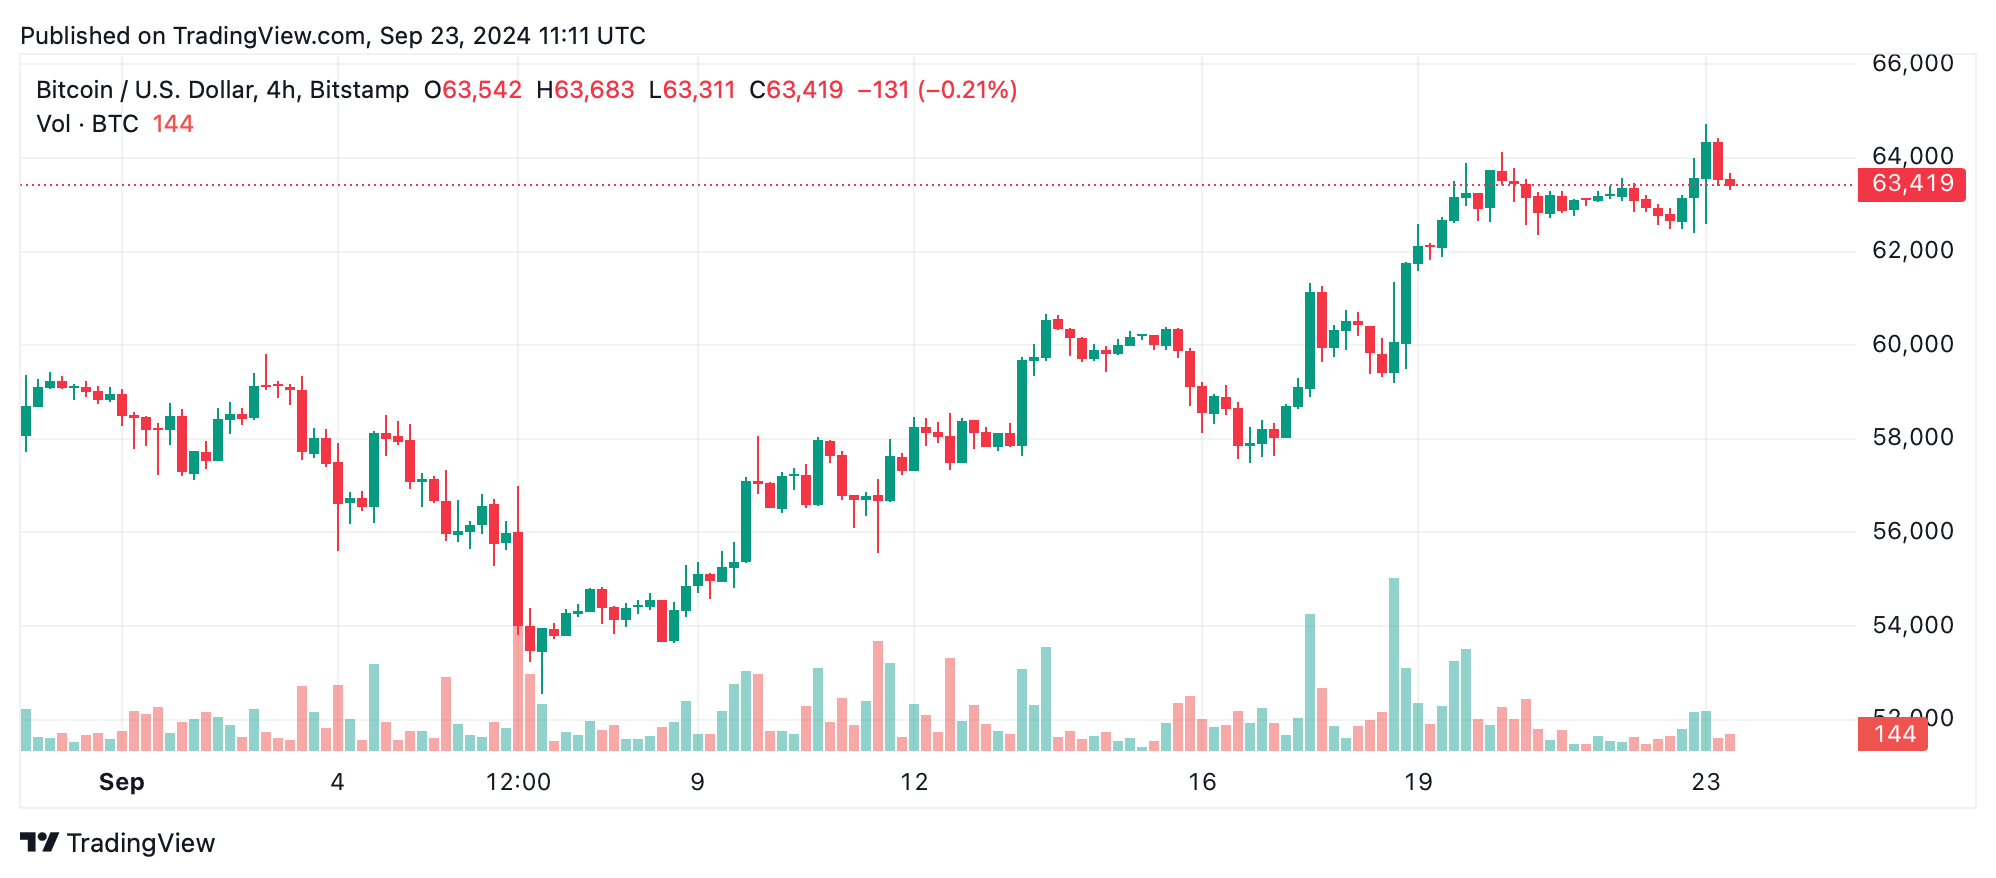
The 4-hour chart reflects similar behavior, with bitcoin consolidating between $63,500 and $64,000 after an initial rally from $59,000. A bearish downturn followed by indecisive price action underscores market uncertainty. With high volume driving the rally to $64,000, the recent tapering in volume may suggest a weakening buying interest.
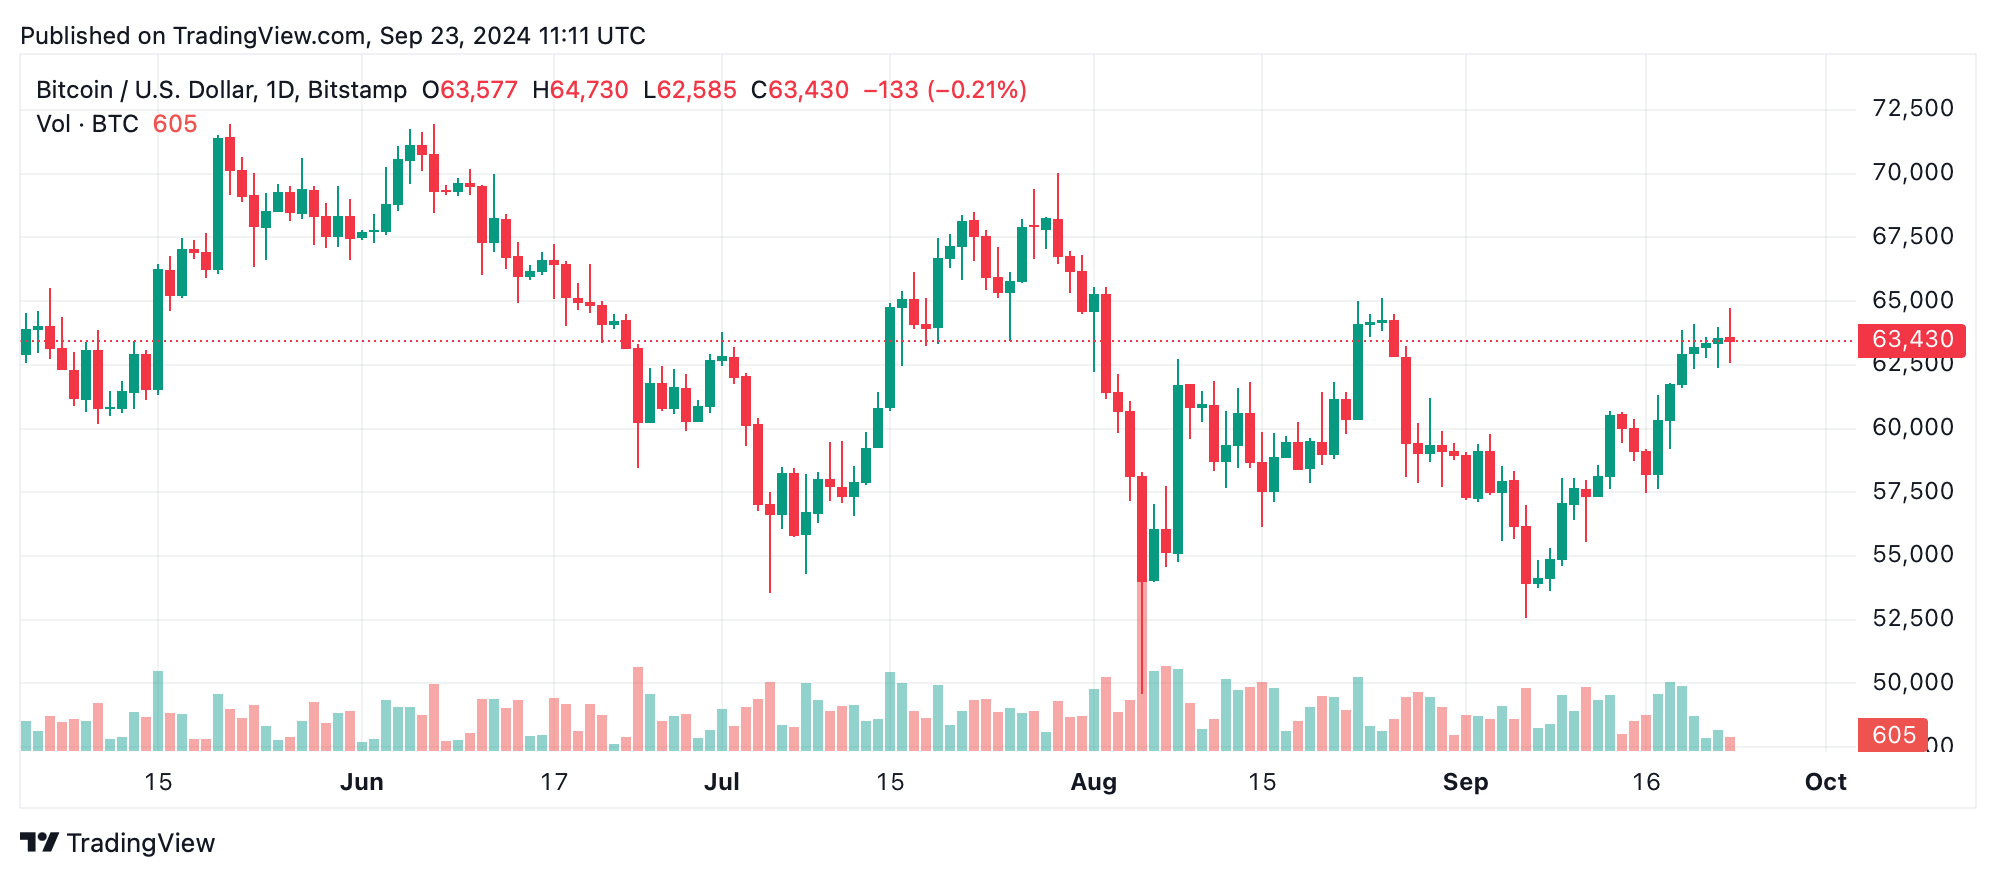
Moving to the daily chart, bitcoin’s broader uptrend remains intact, with support firmly established between $60,000 and $61,000. The price has surged from early September lows of $52,546 to test highs around $65,000. A breakout above the resistance level of $64,730 could trigger further upward momentum, targeting $65,000 and beyond. However, declining volume since mid-September hints at the potential exhaustion of buying pressure.
Oscillators present mixed signals. The relative strength index (RSI) stands at a neutral 63, suggesting neither overbought nor oversold conditions. However, the Stochastic and commodity channel index (CCI) both signal bearishness, indicating potential short-term retracements. Momentum indicators, such as the awesome oscillator and moving average convergence divergence (MACD), offer contrasting perspectives, with the latter pointing to a potentially bullish signal.
Finally, bitcoin’s moving averages (MAs) indicate strong support for the ongoing uptrend. The 10, 20, 50, and 100-period exponential and simple moving averages (EMA & SMA) all indicate optimism, reinforcing bullish sentiment. The only exception is the 200-period SMA, which reflects a sell signal at $63,922, indicating caution as bitcoin approaches key resistance levels.
Bull Verdict:
Bitcoin’s strong uptrend and support from key moving averages suggest that a breakout above $64,730 could lead to new highs, with targets of $65,000 and beyond. If the market regains momentum and buying volume increases, bitcoin could continue its bullish trajectory, reinforced by favorable moving averages and a solid foundation around $61,000.
Bear Verdict:
A failure to break the $64,730 resistance, coupled with declining volume and sell signals from oscillators, indicates the potential for a short-term pullback. If bitcoin breaks below $62,500, we may see further declines toward the $60,000–$61,000 support zone, as the market shows signs of exhaustion and indecision.