Bitcoin’s price has been consolidating below the $60K level over the last few weeks.
However, things might be about to change soon as the asset flew to an 8-day peak of almost $58,500 earlier today.
Technical Analysis
By Edris Derakhshi
The Daily Chart
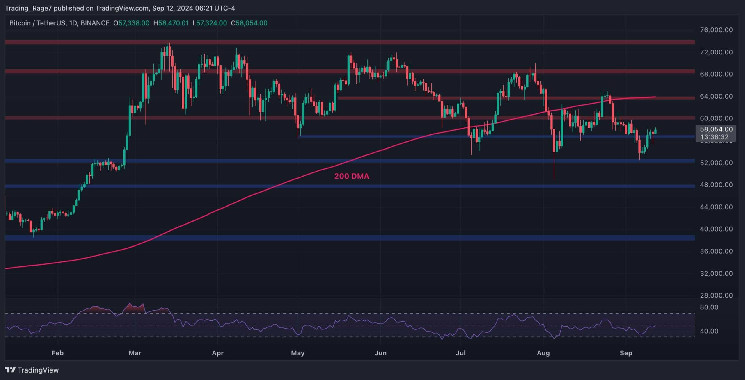
On the Daily chart, the price has recently rebounded from the $52K support level and has broken back above the $57K mark. Currently, the market is likely to rise toward the $60K resistance level in the coming days.
Meanwhile, the RSI is also climbing above the 50% threshold, which would point to a potential uptrend in the short-term.
The 4-Hour Chart
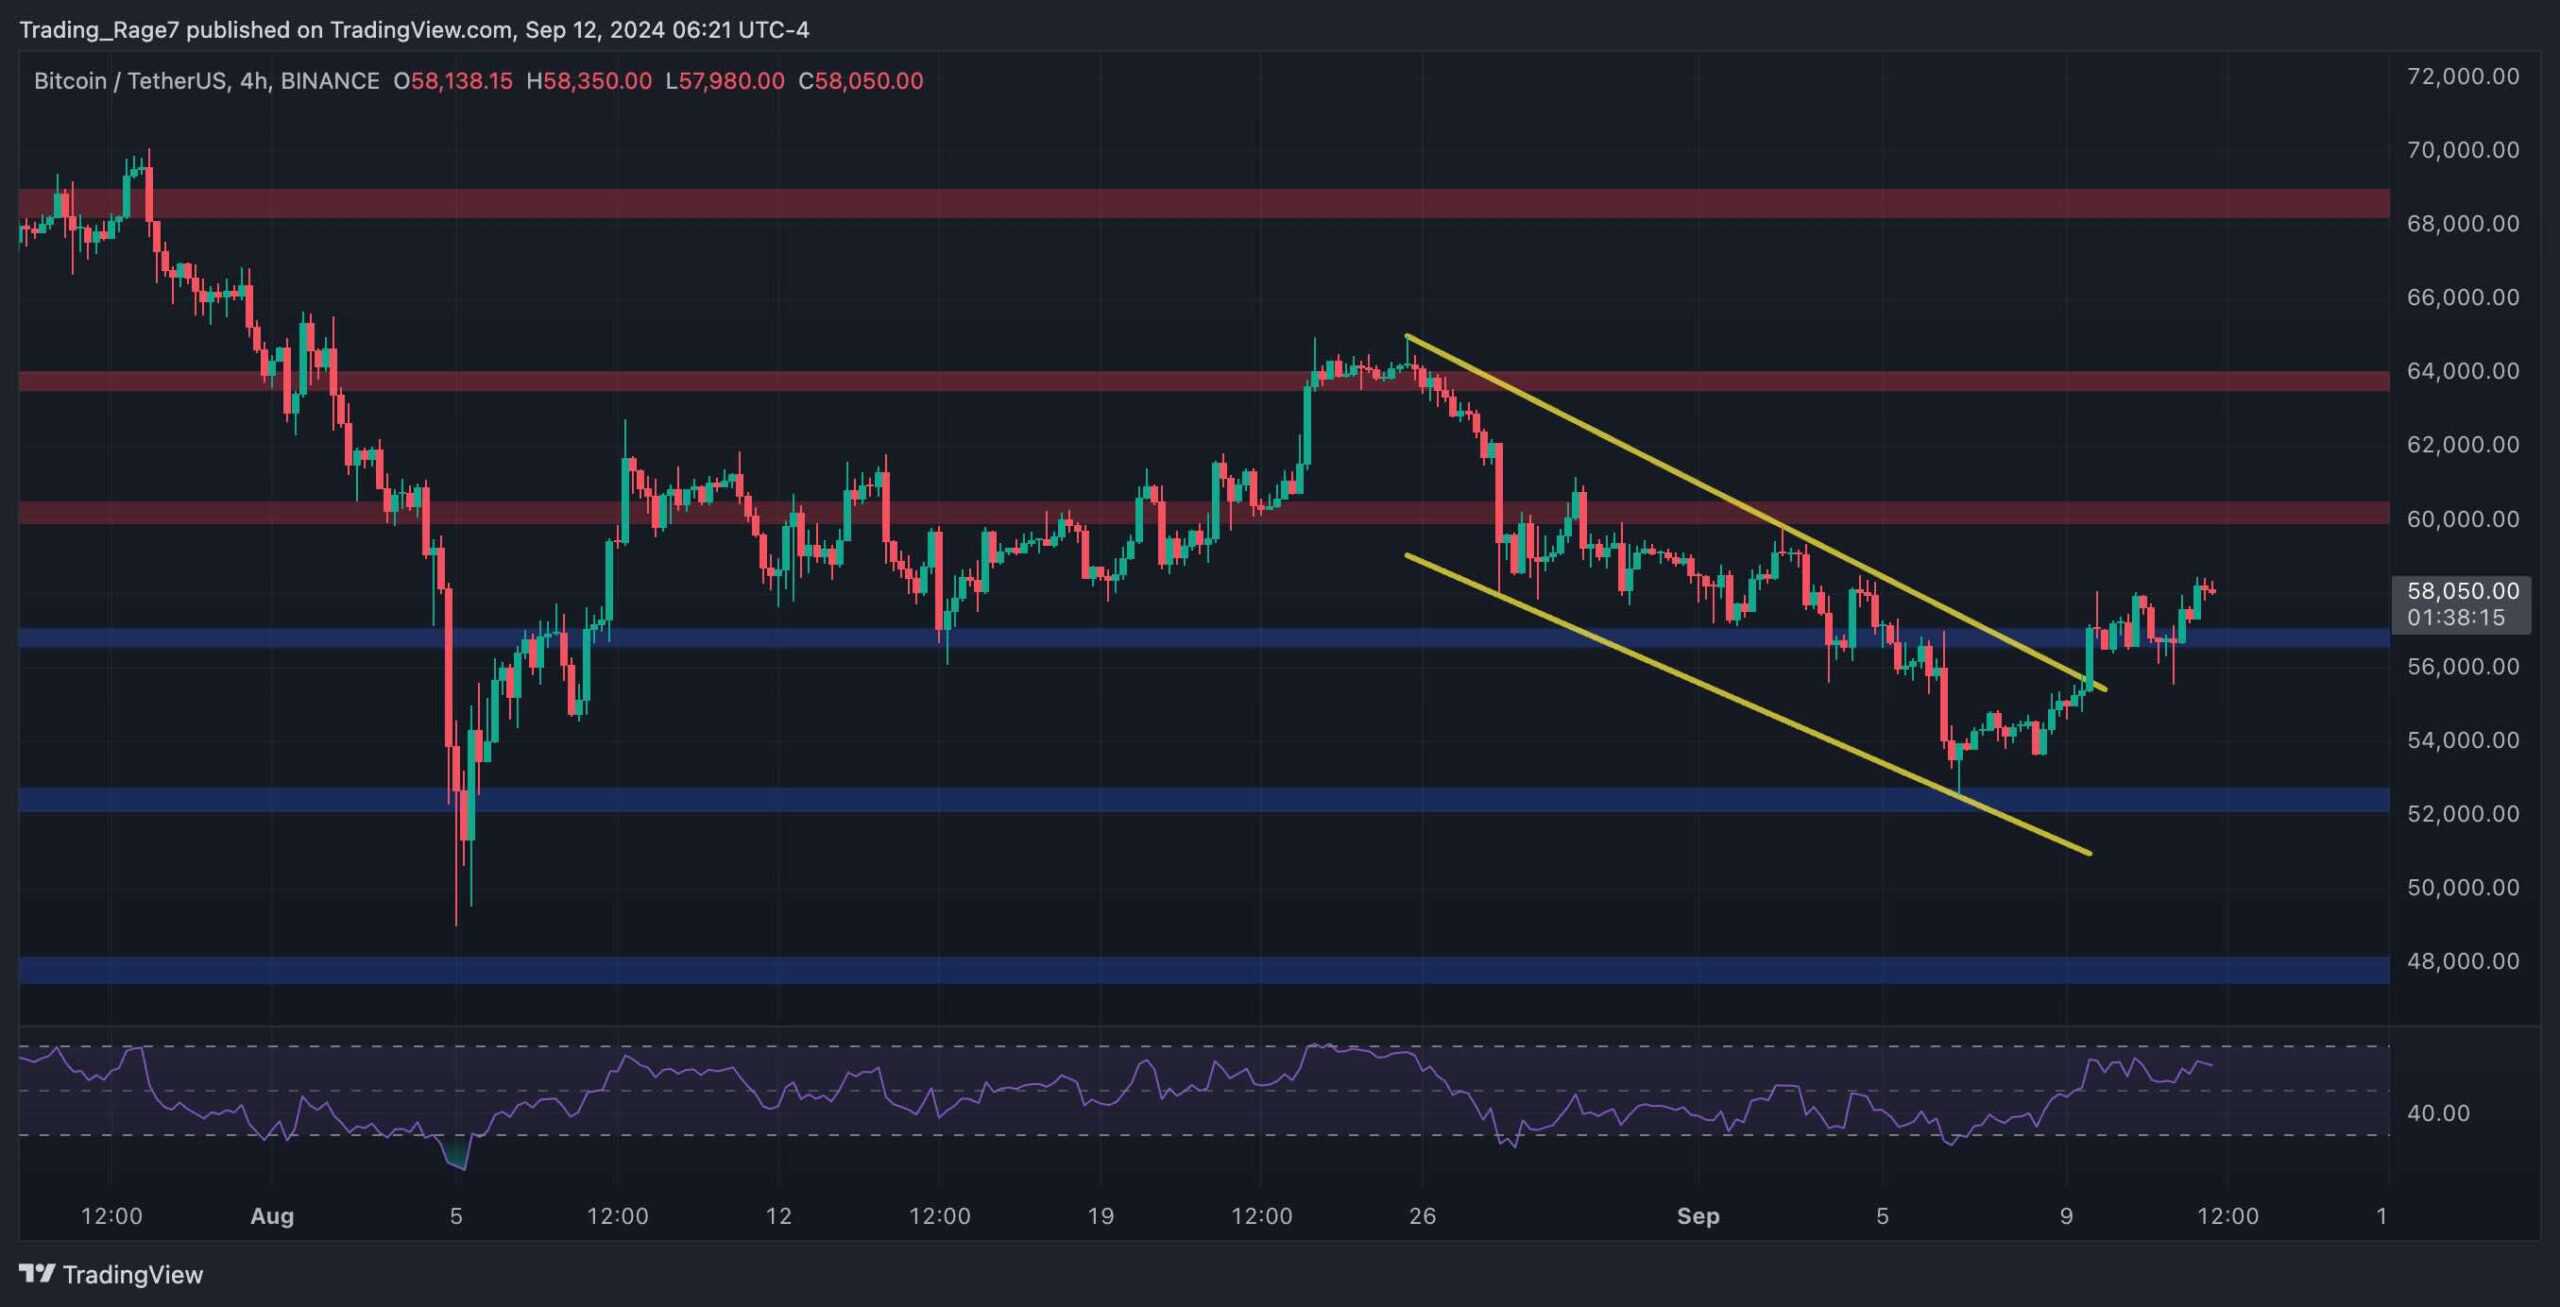
The 4-hour chart also demonstrates a classical bullish price action pattern. The market has been declining in a descending channel. However, it has recently broken above it.
Based on classical price action, this pattern will result in a bullish rally, which could lead to an uptrend toward the $60K and even the $64K levels. Yet, the price must hold above the $57K support level for this scenario to be valid.

On-Chain Analysis
By Edris Derakhshi
Bitcoin Exchange Whale Ratio
While bitcoin’s price has been going through a frustrating consolidation, the underlying market dynamics have changed significantly. Therefore, on-chain metrics can yield beneficial results.
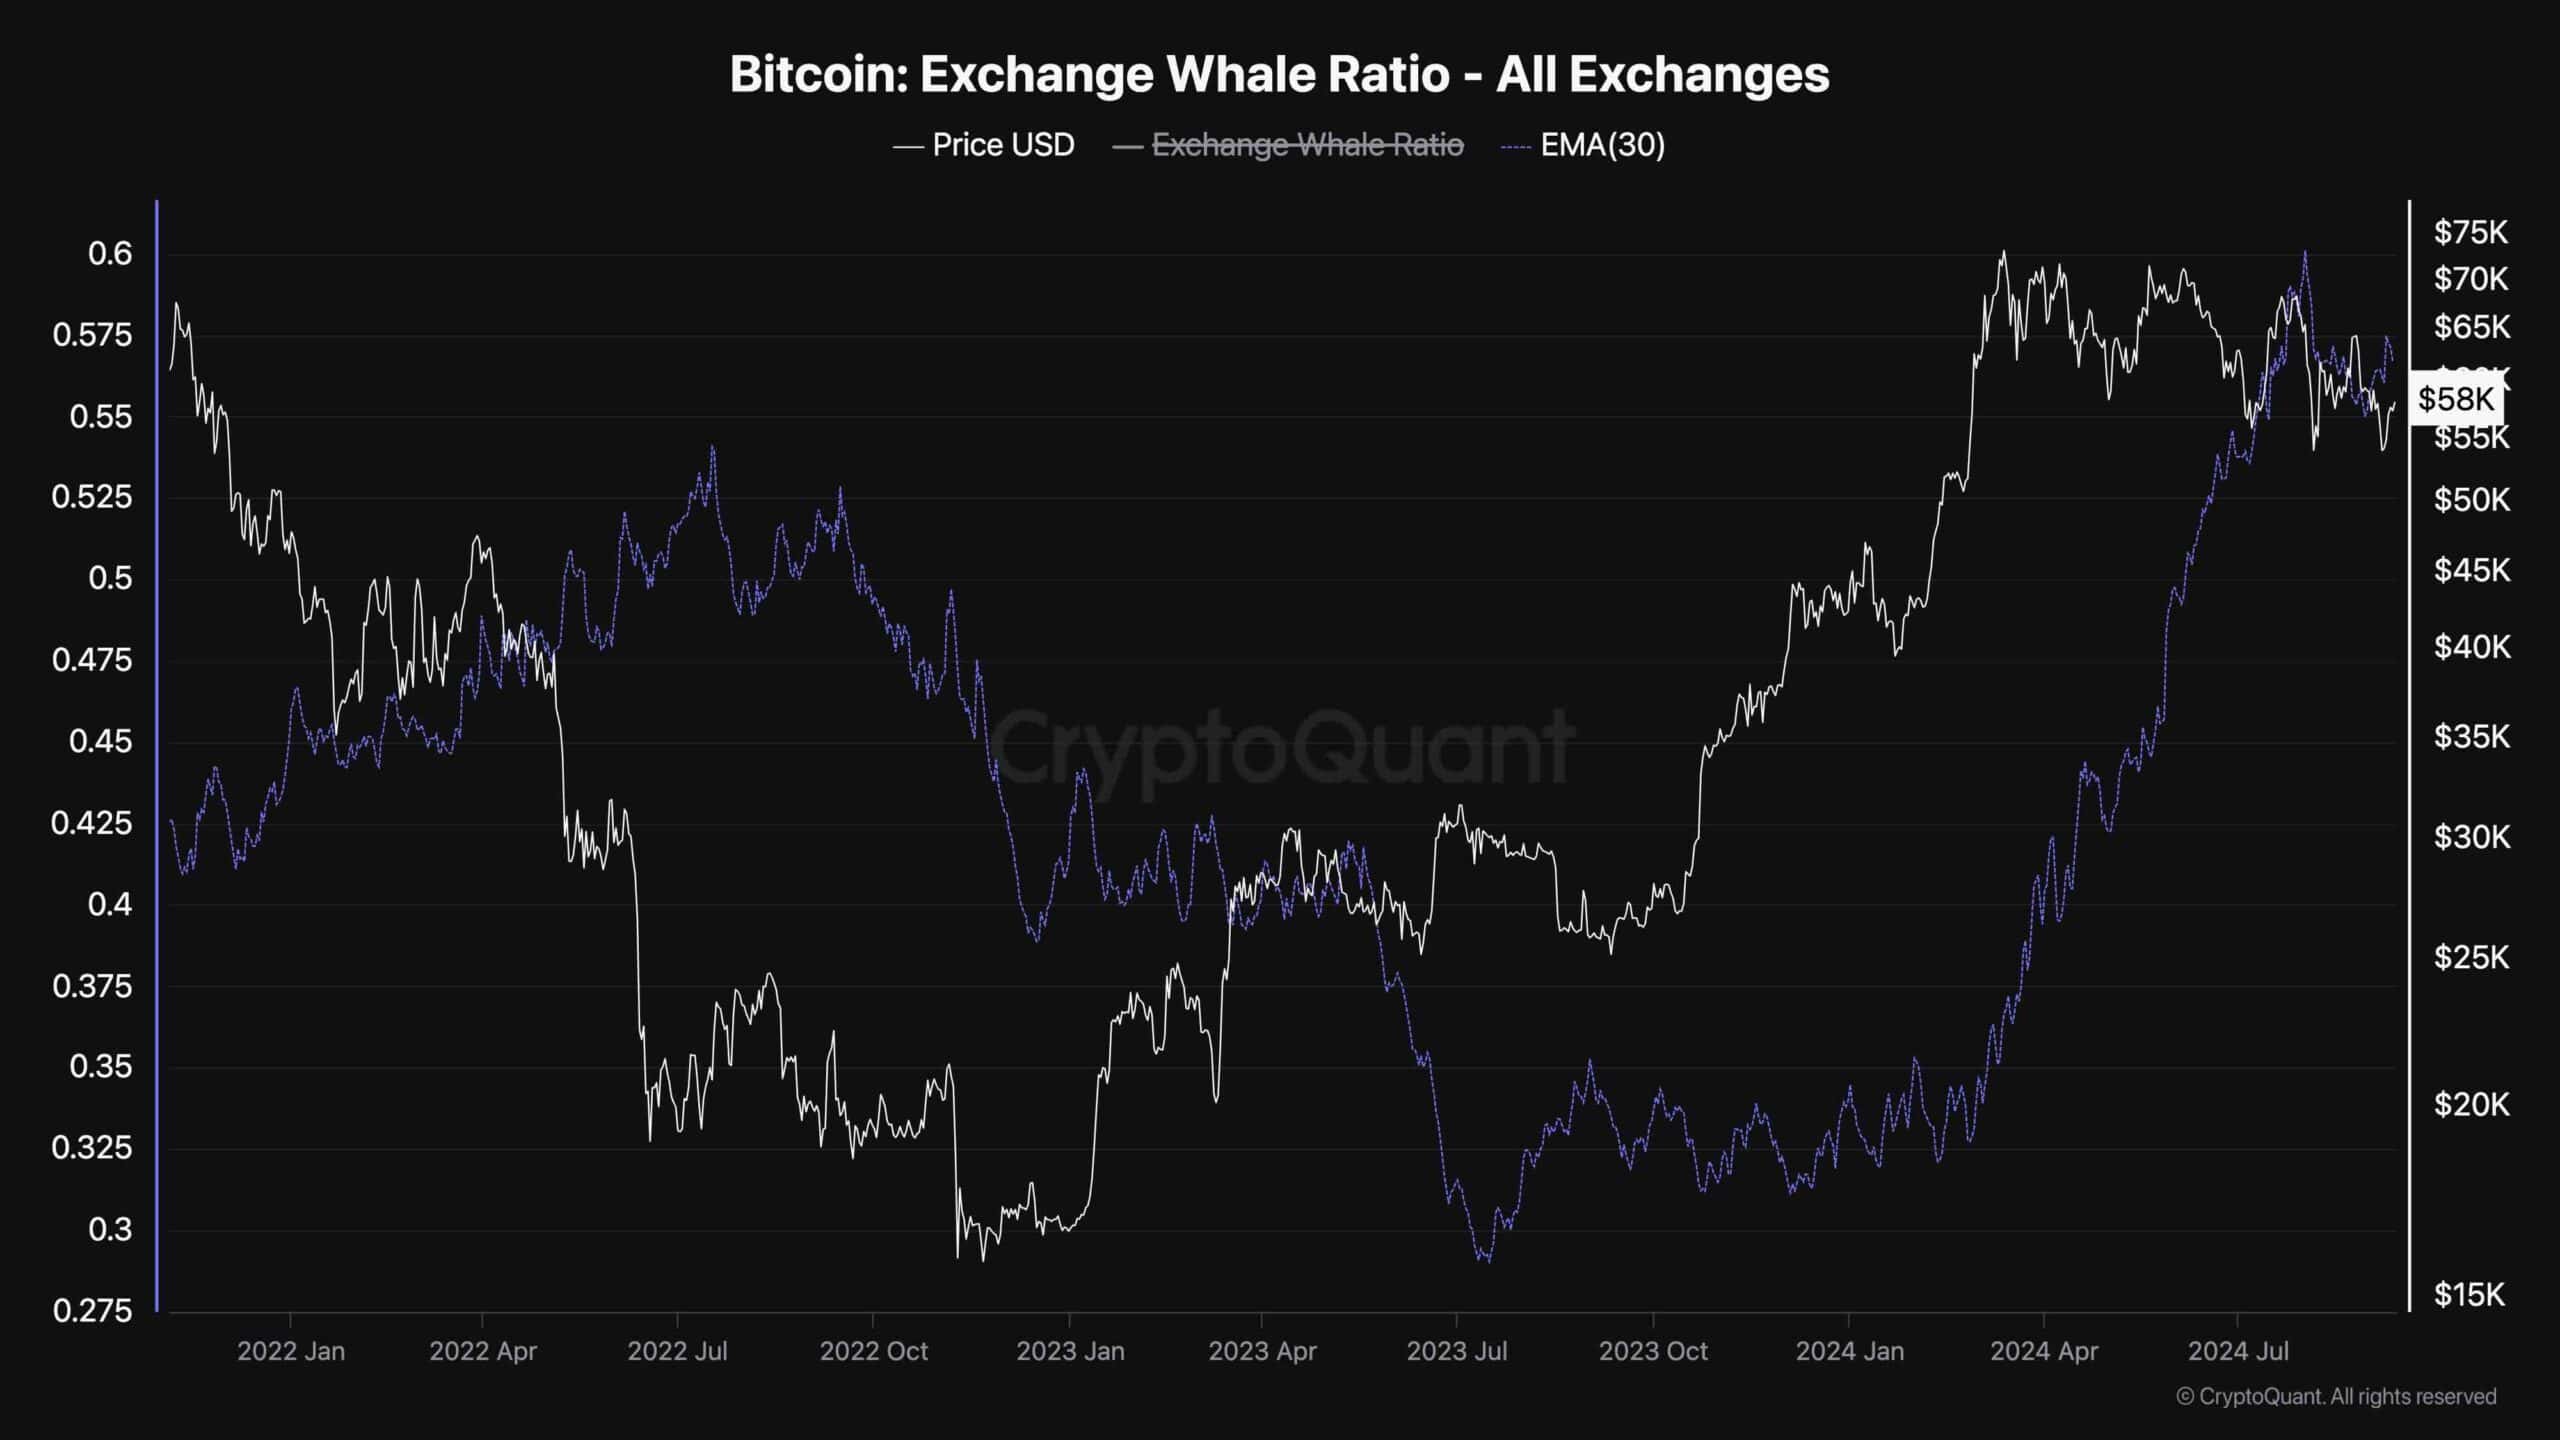
This chart demonstrates the Bitcoin Exchange Whale Ratio, a metric for measuring the ratio of large transactions compared to overall deposits to the exchanges.
As the chart suggests, the Exchange Whale Ratio metric has been rapidly surging during the recent consolidation. This indicates that many large transactions are happening, as some market participants are distributing their BTC while others are accumulating. While the effects of this shift on the price remain to be seen, a significant price move is probable.
 cryptopotato.com