
- Bitcoin price trades broadly stable, extending its consolidation between $57,000 and $62,000, and momentum indicators suggest an impending bearish trend.
- Data Nerd data shows Galaxy Digital withdrew on Monday 400 $BTC worth $23.4 million from Binance on Monday.
- On-chain data shows miners' selling activity is decreasing.
Bitcoin ($BTC) trades around $58,000 on Monday, down 0.7% on the day and extending the consolidation phase between $57,000 and $62,000 seen in the past ten days. From a technical perspective, the bearish thesis still prevails as $BTC struggles to overcome key resistance levels and momentum indicators look weak. Still, investors’ behavior and data about miners’ recent activity suggest a decline in selling pressure, providing some support to the main crypto asset.
Daily digest market movers: Bitcoin selling pressure eases
- According to data from Lookonchain, Ceffu, an institutional-grade custody solutions company for cryptocurrencies and digital assets, has deposited to Binance 3,568 $BTC worth $211.6 million since July 31. Ceffu provides custody and liquidity solutions for institutions, which means it is likely that institutions are selling $BTC. On Monday, it deposited a further 121.10 $BTC worth $7.10 million.
Ceffu has deposited 3,568 $BTC($211.6M) to #Binance since July 31.#Ceffu provides custody and liquidity solutions for institutions, which means it is likely that institutions are selling $BTC. pic.twitter.com/Q9mLFMmC0z
— Lookonchain (@lookonchain) August 19, 2024
- On the contrary, Galaxy Digital, a global cryptocurrency and blockchain investment firm, withdrew 400 $BTC worth $23.4 million from Binance on Monday, according to Data Nerd. At present, its wallet holds 3,609 $BTC worth $221.95 million.
1 hour ago, #Galaxy_Digital withdrew 400 $BTC (~$23.4M) from #Binance.
— The Data Nerd (@OnchainDataNerd) August 19, 2024
Just now, he still hodls 3,609 $BTC (~$221.95M).
Address:https://t.co/MD4R3KD7b3 pic.twitter.com/8HALxdC5E8
- CryptoQuant data about Bitcoin's Puell Multiple indicator, which offers valuable insights into the cryptocurrency's mining profitability cycles, suggests that miners’ selling pressure is abating.
- The indicator measures the ratio between Bitcoin's daily issuance value in USD and its 365-day moving average. When the Puell Multiple is high, it indicates that Bitcoin miners are earning higher USD-denominated rewards than historical averages, potentially leading to increased coin sales to cover expenses or capitalize on profits. Conversely, a low Puell Multiple suggests that miners earn less than the historical average, which could indicate reduced profitability or less selling pressure from miners. Currently, Bitcoin's Puell Multiple stands at 0.7, potentially indicating a period of reduced profitability or decreased selling pressure.
- Additionally, the metric saw significant declines during the bull cycles of 2016 and 2020, when Bitcoin price rallied. A similar pattern can be observed in 2024, suggesting that a potential price adjustment period is nearing its conclusion. While pinpointing the exact end of this adjustment phase is challenging, a potential start of a bullish rally could happen by the end of the third quarter of 2024.
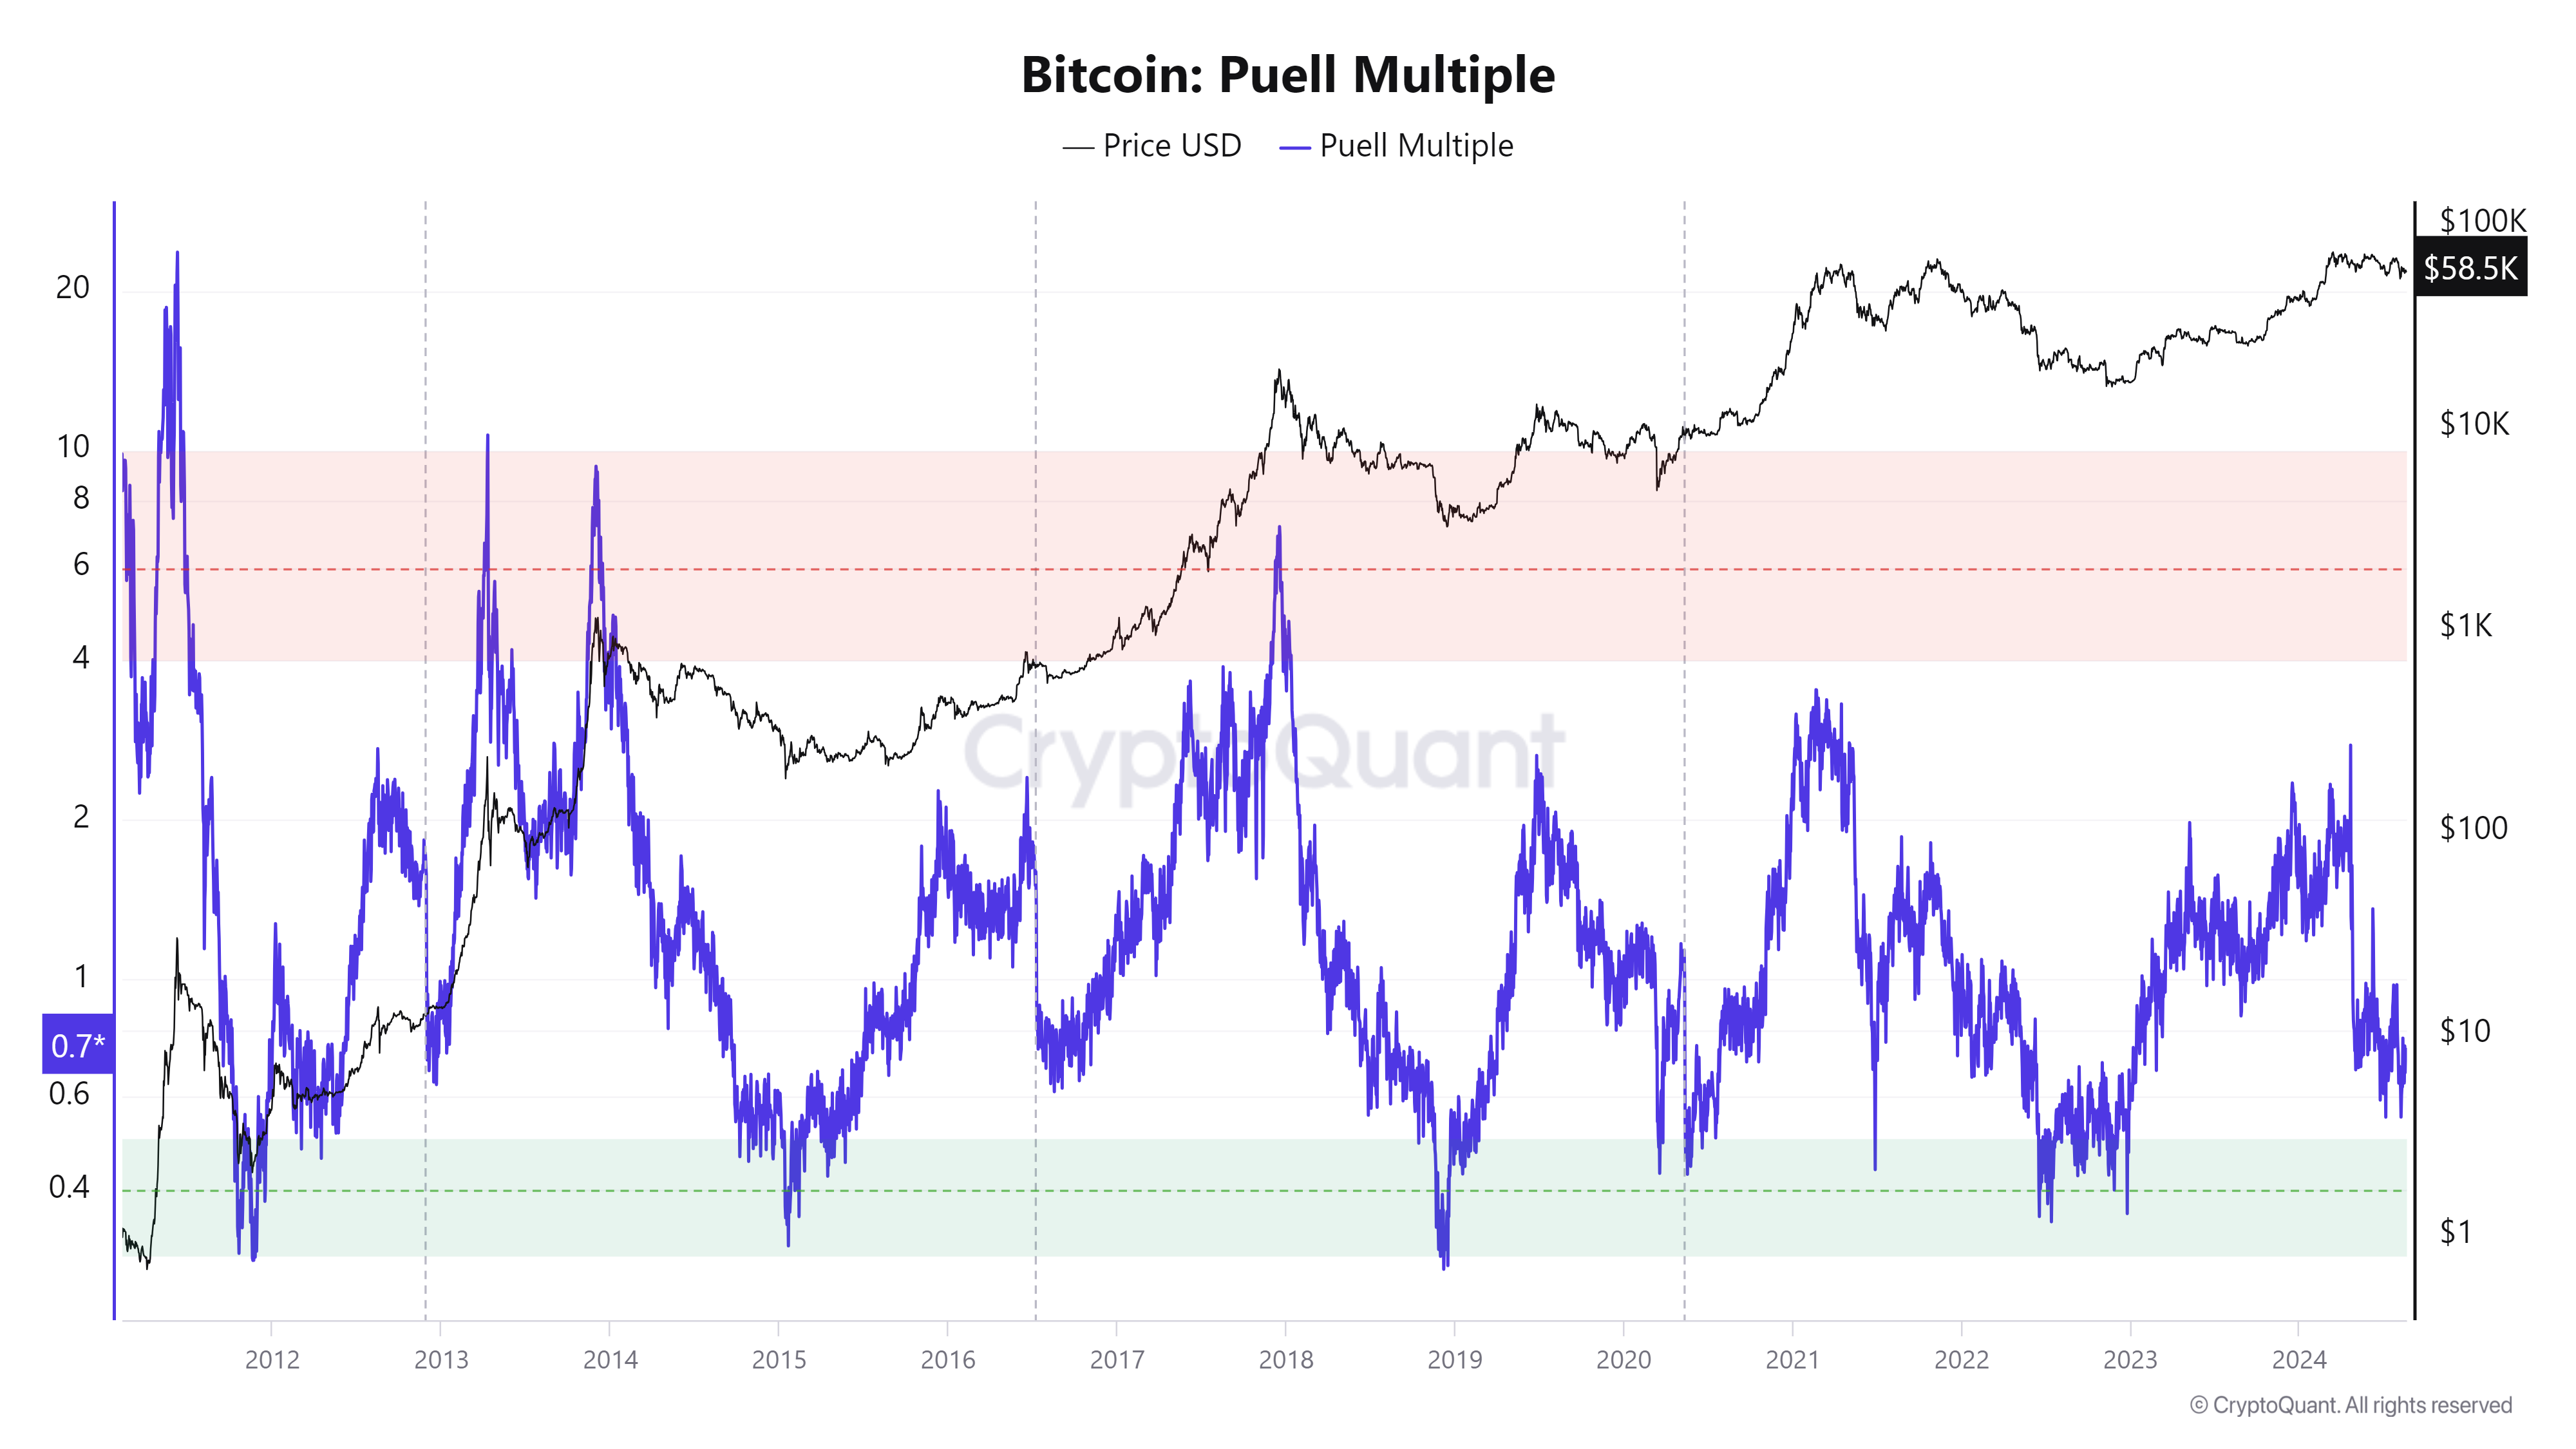
Bitcoin Puell Multiple chart
- CryptoQuant data shows that Bitcoin long-term holders realized capitalization has surpassed $3 billion, an encouraging sign for $BTC’s price outlook in the long term.
- The chart below shows the net position realized cap for short-term holders (STH) and long-term holders (LTH) of Bitcoin over time. Short-term holders buy and sell Bitcoin over a relatively brief period, usually less than one year, with the goal to profit from short-term price fluctuations. These holders typically use trading strategies such as day trading, swing trading, or scalping to leverage market volatility. On the contrary, long-term holders are skilled traders or entities that hold onto their Bitcoin for an extended period, typically over a year, as they adopt a buy-and-hold investment strategy because they believe in the long-term potential of Bitcoin.
- In $BTC's case, LTH realized cap changes have moved back into the positive territory above $3 billion while STH increased selling (green boxes on the chart). This indicates that LTH accumulates while STH sells at a lower price.
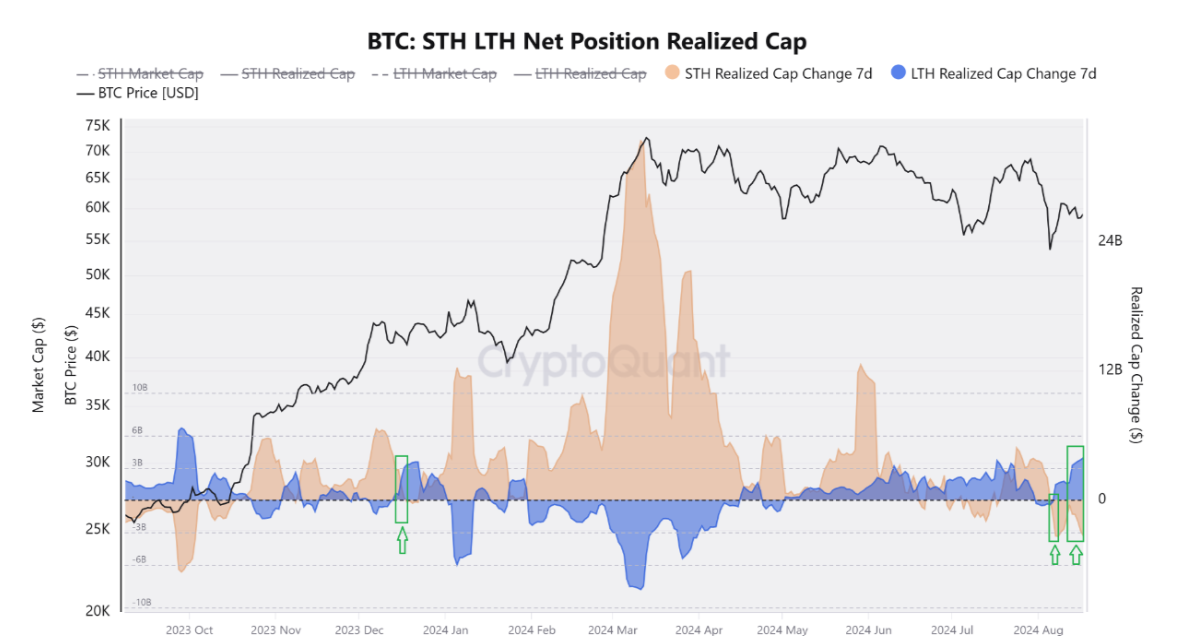
Bitcoin STH LTH Net Position Realized Cap chart
Technical analysis: $BTC extends consolidation
Bitcoin price continues to consolidate between $57,115 and $62,066, the Fibonacci retracement levels of 38.2% and 61.8%, respectively, drawn from the high from July 29 to the low from August 5. On Monday, it trades slightly higher by 0.7% at $58,000.
Suppose $BTC rises back to the 61.8% Fibonacci retracement at $62,066. In that case, it may find some resistance at this level, as it aligns with the previously breached trendline and the 100-day Exponential Moving Average of around $62,226, making it a key resistance zone.
Failure to surpass $62,066 could lead to a drop to $57,115 before potentially declining by 19% to revisit the $49,917 daily support level.
On the daily chart, the Relative Strength Index (RSI) and Awesome Oscillator (AO) trade below their neutral levels of 50 and zero, respectively, suggesting momentum is weak.
$BTC/$USDT daily chart" src="https://cnews24.ru/uploads/5f5/5f5da2f9fa882be2e6bf3fc901676235faa45a0c.png" size="1815x779">
$BTC/$USDT daily chart
On the other hand, if Bitcoin's price can close above $62,066, a rise towards the August 2 high of $65,596 would be on the cards as it would set a higher high on the daily chart. This could lead to a further 6% price increase to test the weekly resistance at $69,648.