
Bitcoin has been trying to cross the $70,000 mark in order to create a new ATH. Since $BTC marked $73,000 as the all-time high of this season, the market has been waiting for another one. However, various factors that include market and non market elements have been preventing it from happening. These reasons include Mt. Gox repayment, German government selling off seized 50k Bitcoin, political uncertainty in the U.S., multiple hacks. Now that all these things have been in the past, why is btc still not rising to $100k? Let’s explore the reasons.
Bearish Chart Indications
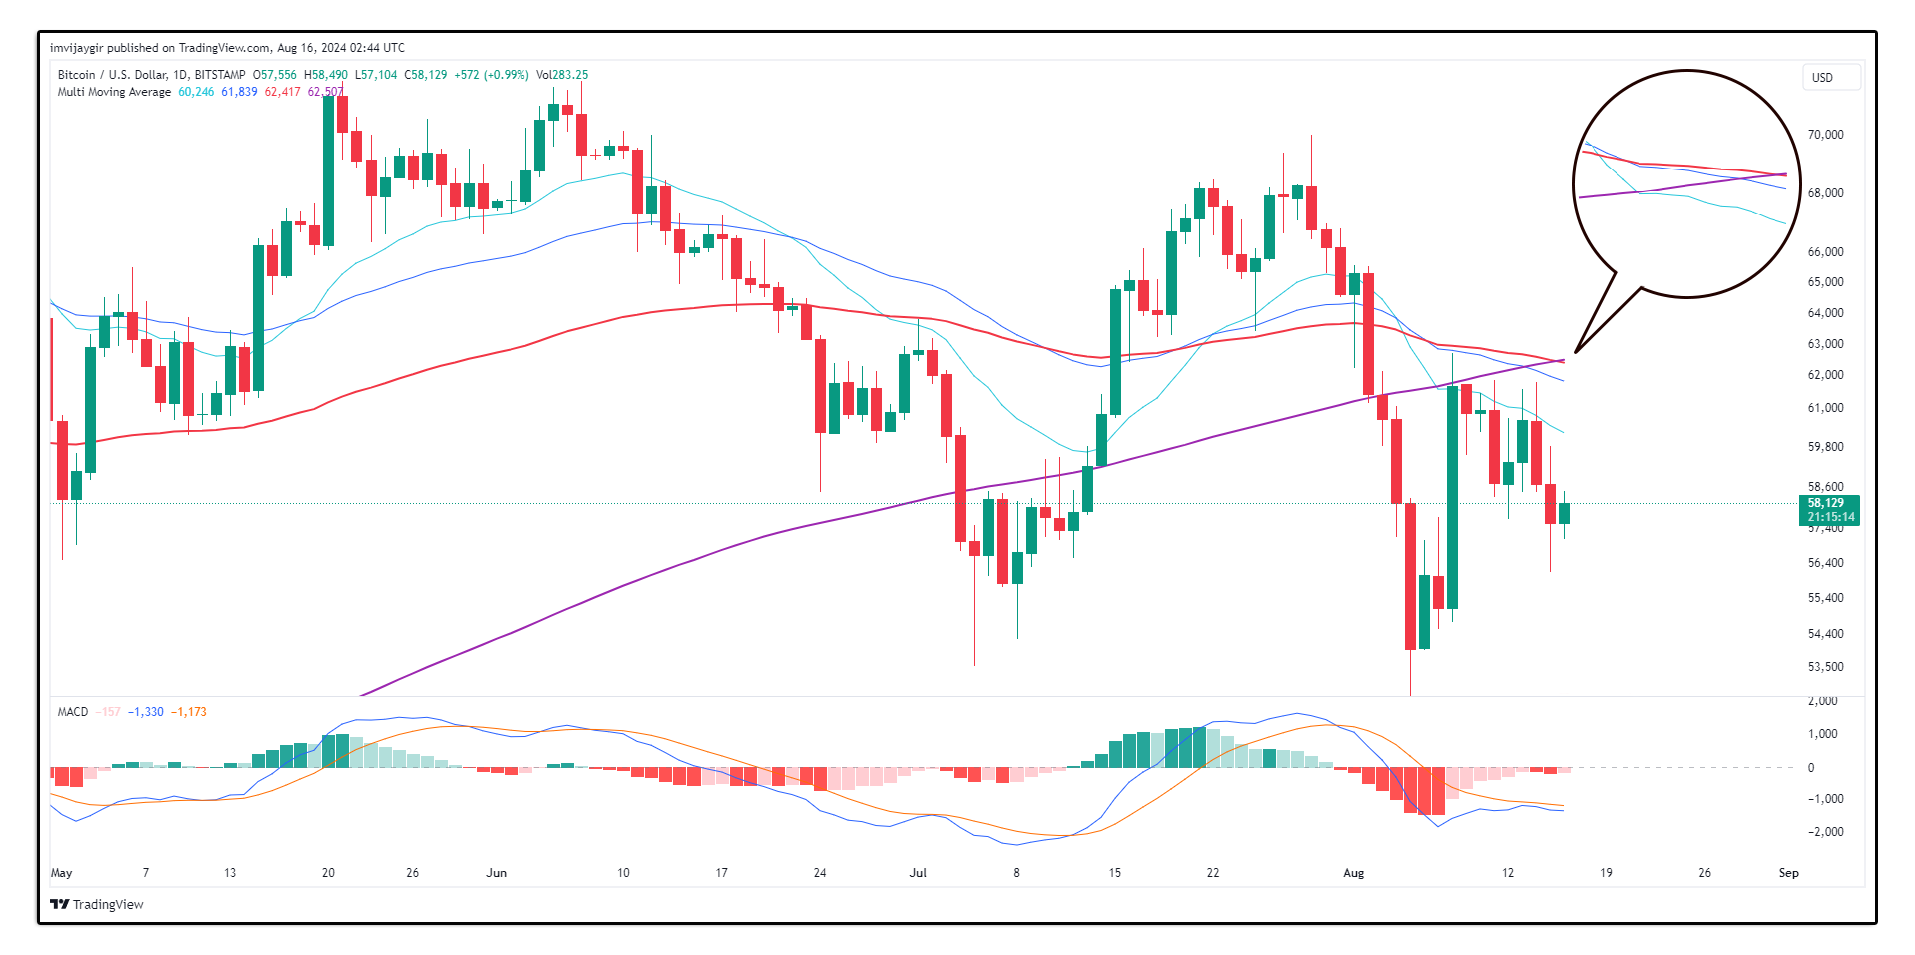
At the time of writing, Bitcoin is trading at $58,129. The moving averages on a daily chart have been tangled badly. The 20 daily moving average has crossed down all the other MAs in the last week and is sitting at around $59,800 and acting as a resistance. 200 MA has crossed every other moving average and now is at the top. Today, it created a death cross over, which is a highly bearish sentiment.
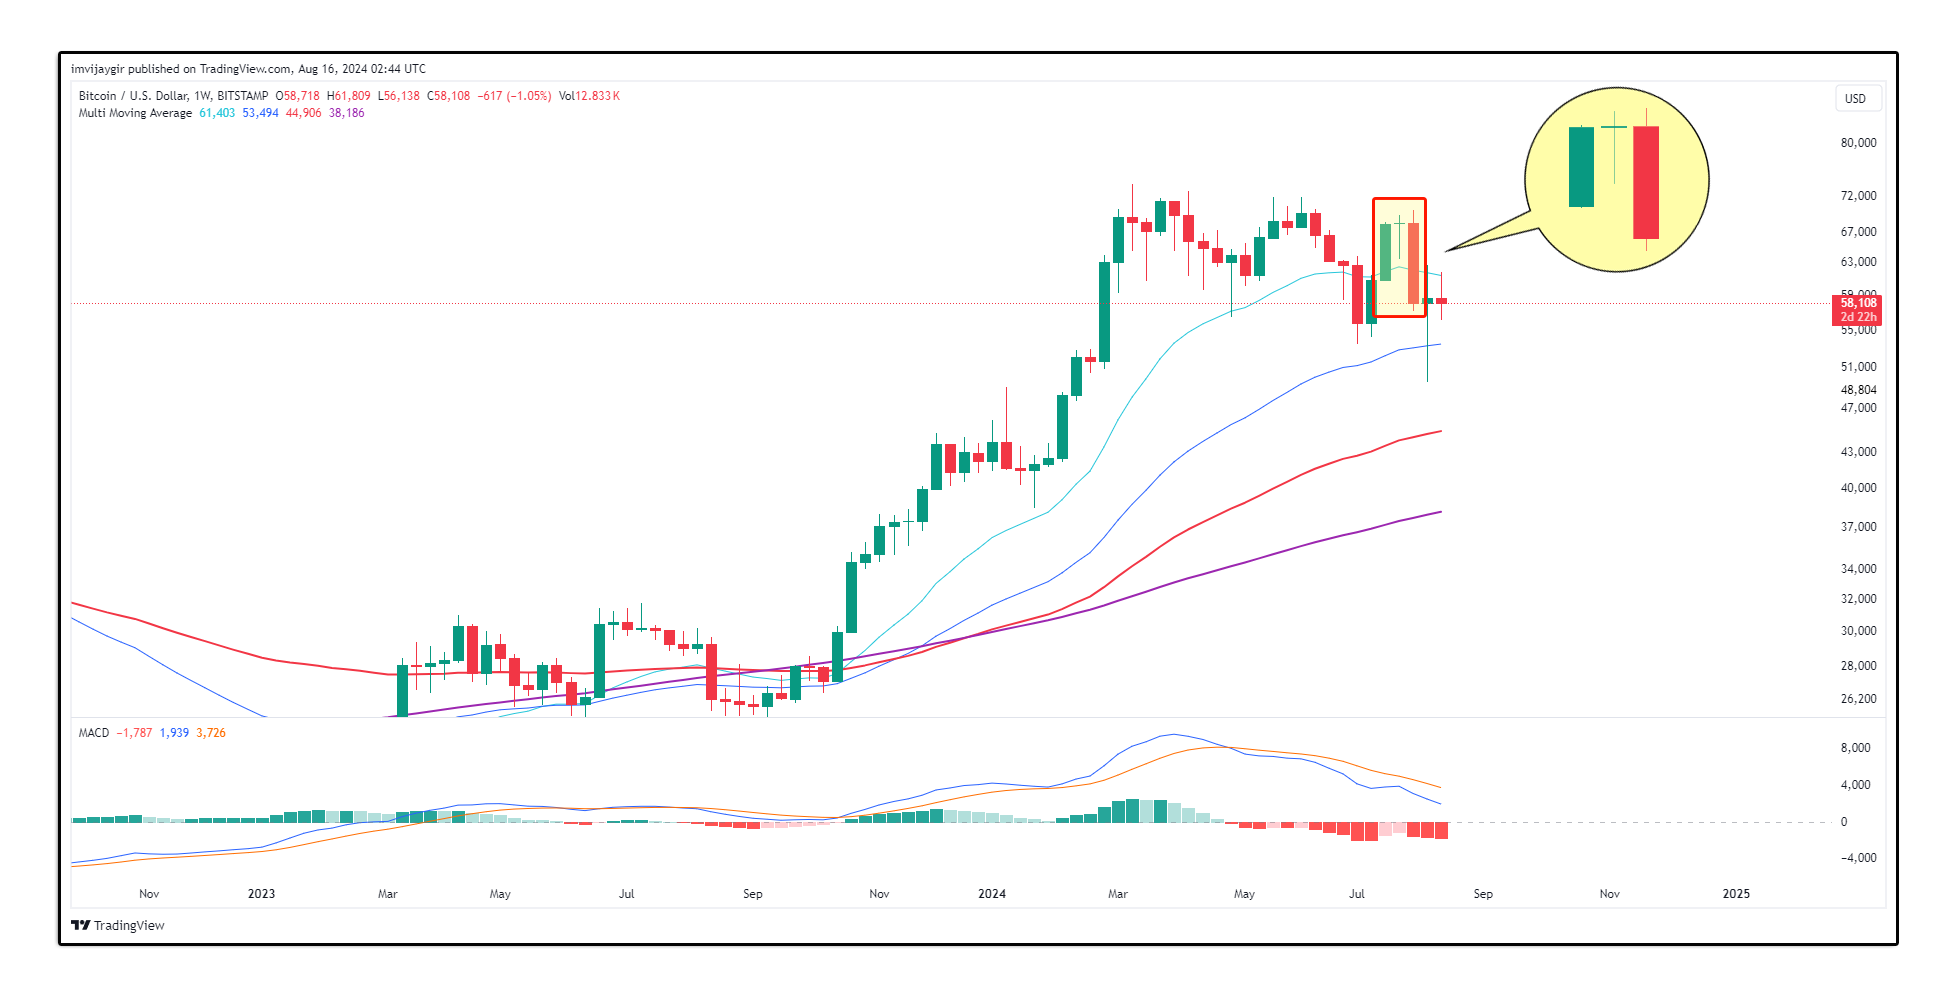
Weekly chart of Bitcoin shows another big negative movement coming ahead. Just 2 weeks ago, we saw an evening star candle pattern. As this was the top of this trend, the evening star might become very powerful, considering the rise of bears in MACD histogram. The latest support, MA 50 lies around $51,000 and 20 weekly moving average is acting as the active resistance.
Bitcoin Bearish Months
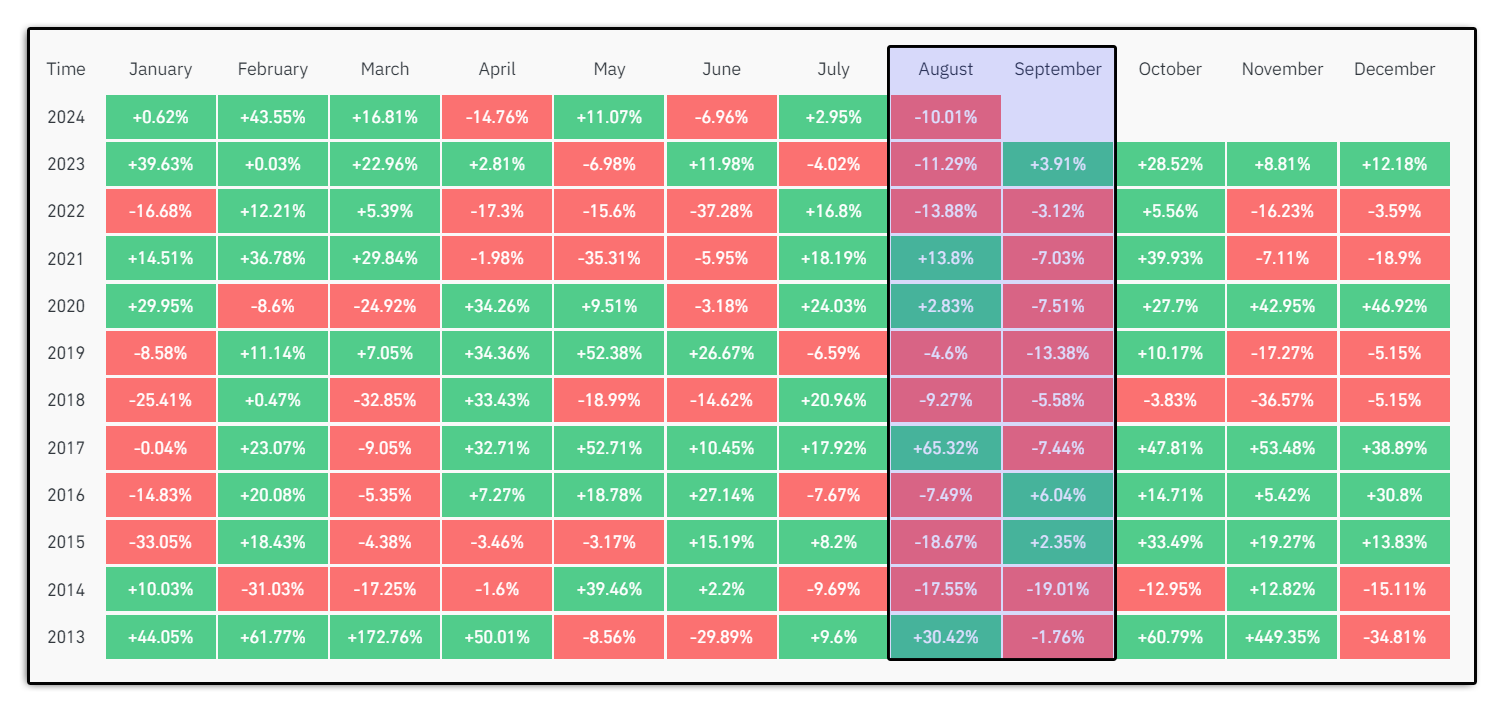
The monthly profit-loss data from Coinglass shows that August and September have been the most bearish months for Bitcoin. In August 2024, we have already seen a loss of 10% in Bitcoin. For the last decade, September has been the most bearish month of all. However October has been recorded as the most bullish time. On an average quarter four of every year has recorded positive movement for Bitcoin.
Fear and Greed Index
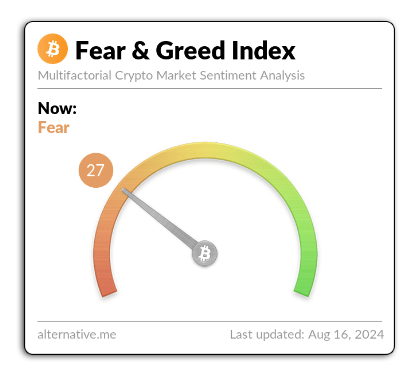
Fear and Greed index is one of the prominent indications of the market sentiment. It represents the current psychology of the market. Last month, this index was recorded at point 69, which shows there was high greed in the market and investors put their money into Bitcoin. Since then it has been falling as last week it was at 48 and on August 15 (yesterday), it fell down to 29. This morning it lost another 2 points and was recorded at 27. This fall in the index shows the rising fear in the market and traders are afraid to buy Bitcoin at this price. They are expecting a fall.
Panic Will Cause Selling
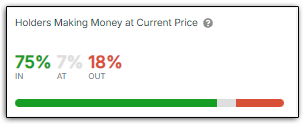
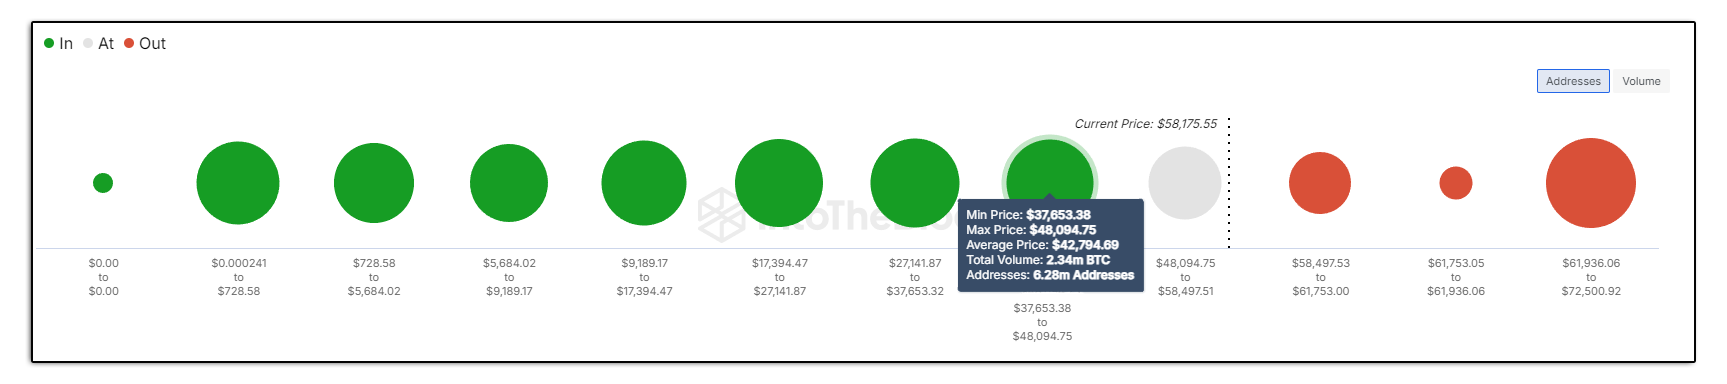
Data from IntoTheBlock shows that at the current price of Bitcoin 75% of the investors are already in the money. This means they are already in profit and incase of the market turning red, they will not hesitate to book their profit. 18% of the investors have bought $BTC above this price and hence they are already in loss and only around 7% of the investors have bought Bitcoin between the price range of $48,094.75 to $58,497.51. These are the people who are currently at the price.
In case, the price starts to move downwards, which is supported by data, there are 6.28 million bitcoin addresses that hold a total of 2.34 million bitcoin, which can book profit. These investors have a buying range between $37,653.38 to $48,094.75.
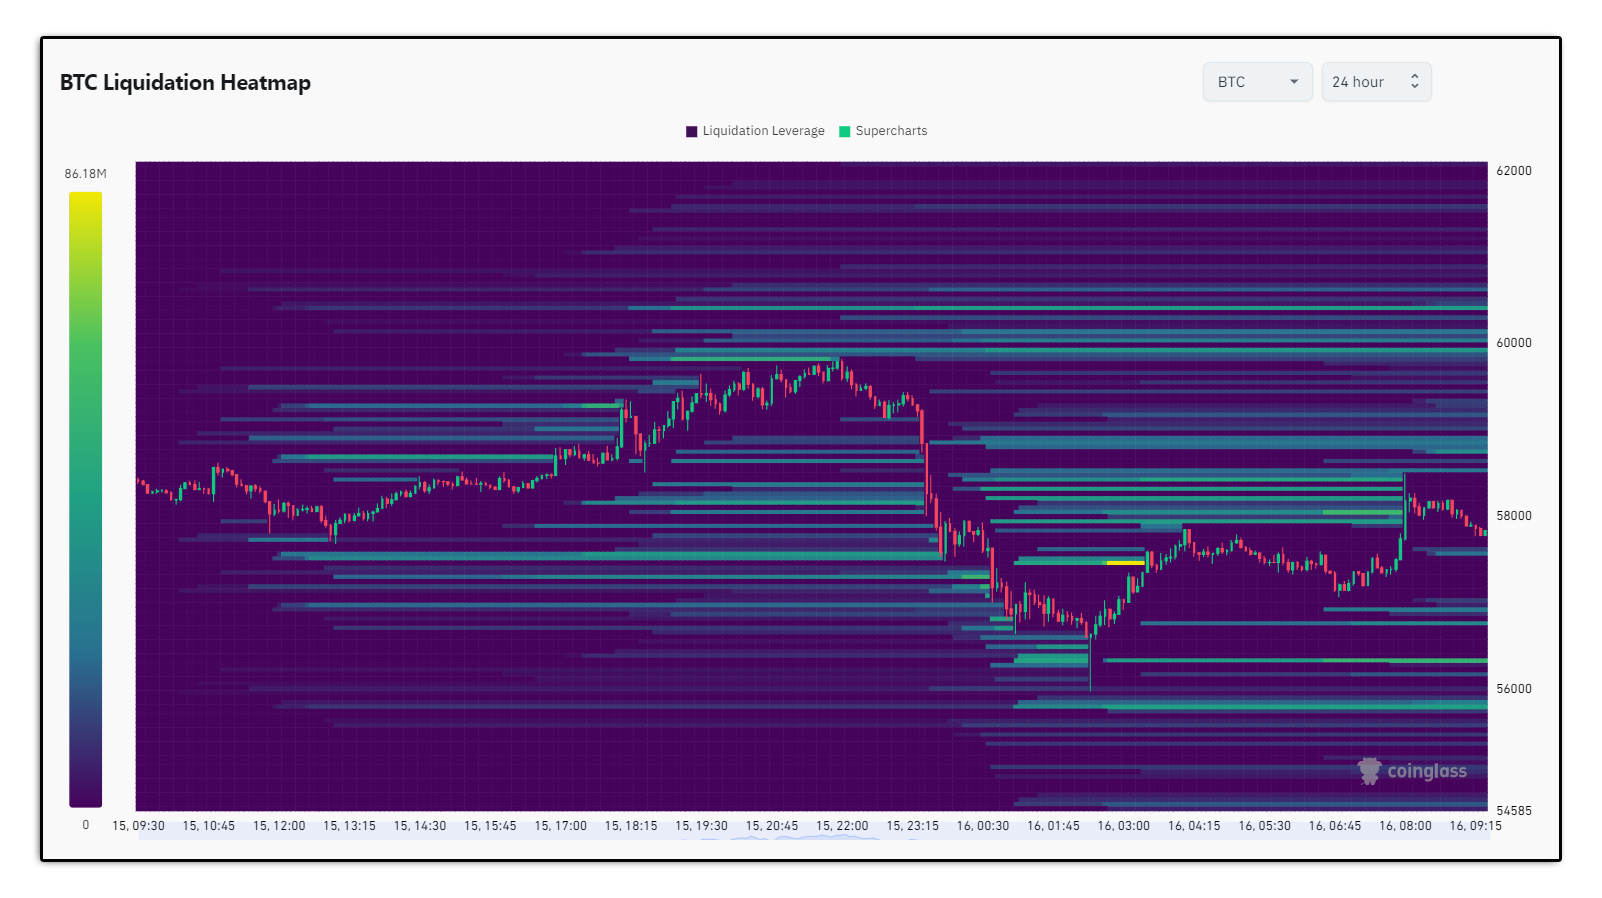
Bitcoin Liquidation Heatmap
The heatmap showing data for Bitcoin liquidity shows that the nearest liquidity point lies below the current price. Compiling all the data with heatmap, there are high chances of Bitcoin moving downwards. Once it starts the downward journey, investors “at the money” will book their profits and will wait for the price to cool off before they enter the market again. This sell off can trigger a panic resulting in a price fall to the next liquidity point around $56,000.
Movement in the U.S. Seized Bitcoin
Arkham Intelligence data shows a movement in the Bitcoins seized by the U.S. government from the Silk Road website. They seized 50,000 Bitcoin from the silk road case and offloaded 9,861 $BTC for about $216 million on 13 March 2023. Government wanted to offload the whole 50 thousand $BTC in the previous year in 4 transactions but did not do it for some reasons. They use coinbase to sell off the btc they are holding.
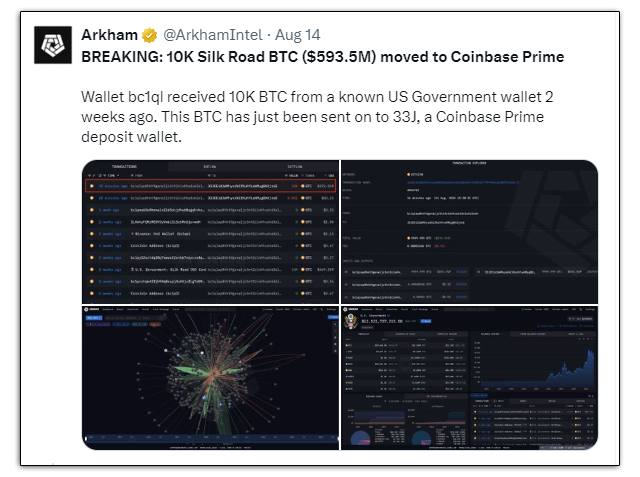
Arkham shows that an address bc1qla…r2zek received 10,000 $BTC from the US government bitcoin wallet which then sent 9448.92 $BTC to Coinbase Prime deposit and 569 $BTC to bc1qyw…df58. The funds are still held by this unidentified wallet.
Looking Ahead
Looking at all the discussed data, we can come to a clean conclusion that there is likely another $BTC fall incoming. All the negative indications by various charts and data, along with the movement of seized bitcoin by the U.S. government which they are likely to sell, points out to one direction : the market is going to see more red. While this is a time of fear for retail investors as the Fear and Greed index shows, whales are taking this as an opportunity to accumulate more Bitcoin. Big institutions are always on the lookout for the time when the price goes down so they can fill up their bags and increase their portfolio.
Retail investors should also take educated decisions during such periods. Instead of dumping, they should do Dollar Cost Average (DCA) which will help them to grow their portfolio and make more profits. If Bitcoin received heavy downside pressure, data shows it might hit the $48,000 zone before turning back.