
Bitcoin’s ($BTC) recent momentum above $60,000 is setting the stage for what could be its next historic rally.
According to a recent analysis by TradingShot, shared on TradingView on August 14, the maiden cryptocurrency might be on track to reach an all-time high of $150,000 by mid-2025.
The prediction is based on the one-month (1M) timeframe, specifically examining the implications of the Moving Average Convergence Divergence (MACD) “bullish cross,” a key indicator of bullish momentum in the market.
Bitcoin’s support at the 0.786 Fibonacci level and the MACD bullish cross
July closed on a positive note for Bitcoin, with the cryptocurrency managing to recover from a sharp decline at the start of August. This recovery is significant as it occurred at the 0.786 Fibonacci retracement level of Bitcoin’s 2021 all-time high (ATH).
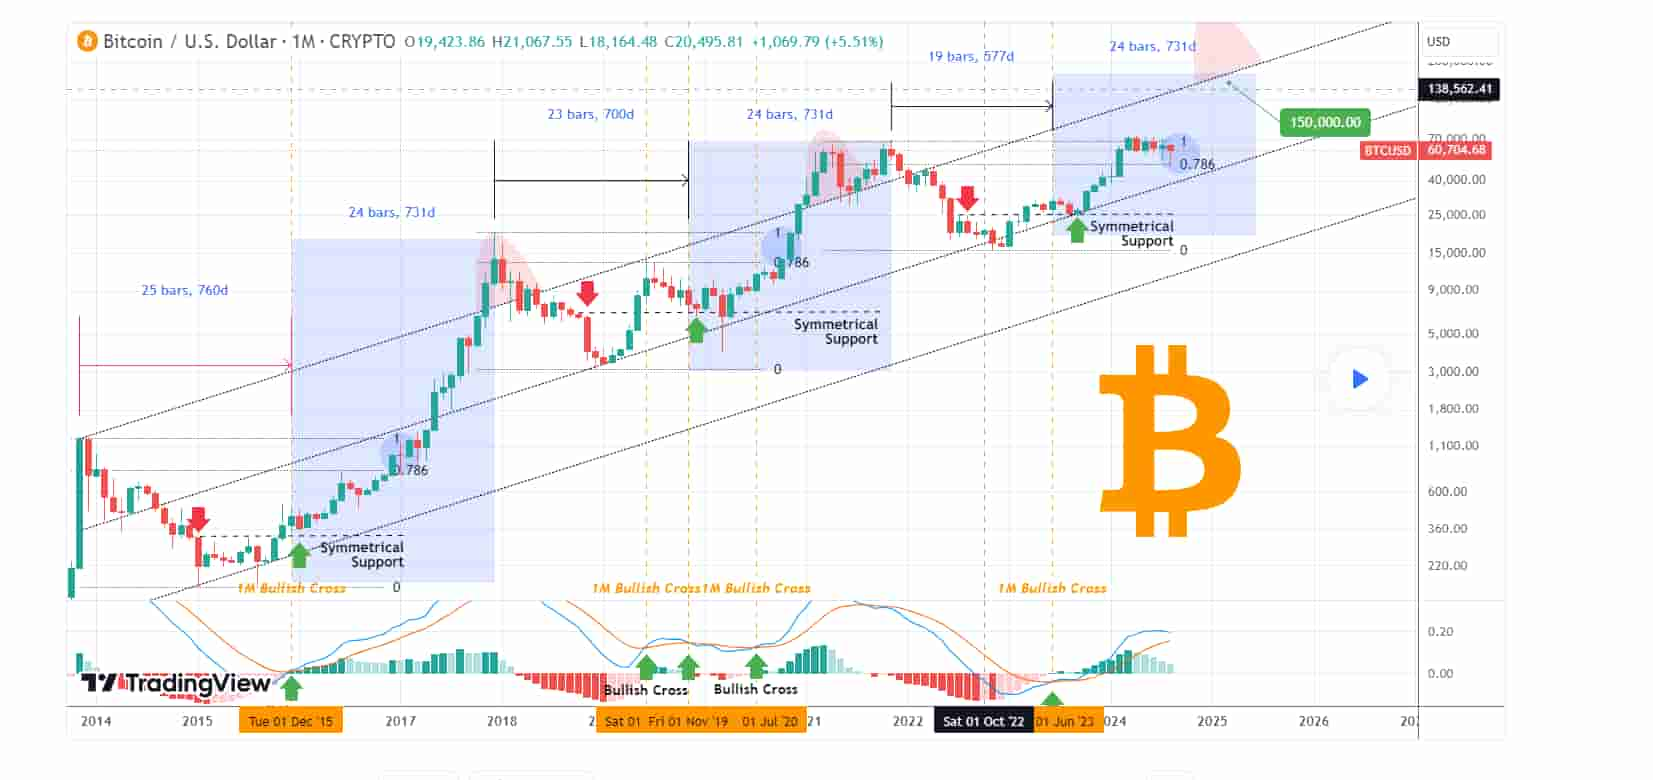
Historically, this level has acted as a strong support zone during consolidation phases, often signaling a potential bullish reversal.
Furthermore, several instances of MACD bullish crosses on the monthly timeframe are highlighted, showing that this trend-following momentum indicator typically coincides with the beginning of significant rallies.
These crosses, where the MACD line moves above the signal line, indicate a potential shift from bearish to bullish momentum. Notably, the most recent cross in June 2023 mirrors patterns observed in November 2019 and December 2015, both of which were followed by significant price increases over the next 24 months.
Moreover, it is noted that previous bull cycles saw Bitcoin peaking 24 months (731 days) after the MACD cross. Given that the June 2023 cross occurred 19 months after the previous peak, this cycle projects a potential Bitcoin peak around mid-2025, likely in June.
‘Channel Up’ pattern points to higher price targets
Another critical element of the analysis is the “Channel Up” pattern, a series of higher highs and higher lows that Bitcoin has adhered to since 2014. This pattern suggests that Bitcoin could be on a trajectory toward values between $200,000 and $300,000.
However, a more cautious approach still points to a potential price target of $150,000 by mid-2025, aligning with the upper boundary of the dotted channel, a level that could attract significant profit-taking.
Key levels to watch on Bitcoin’s road to $150,000
As Bitcoin continues its upward journey, several key levels warrant close attention. The $24,000 level, tied to the 0.786 Fibonacci retracement, remains a key support zone where buying interest has previously surged.
Should Bitcoin maintain its position above $60,000, a level that may act as a psychological barrier, the next resistance is anticipated around $100,000, a level within the upper half of the “Channel Up” pattern. Breaking past this could pave the way toward the $150,000 target by mid-2025.
Bitcoin price analysis
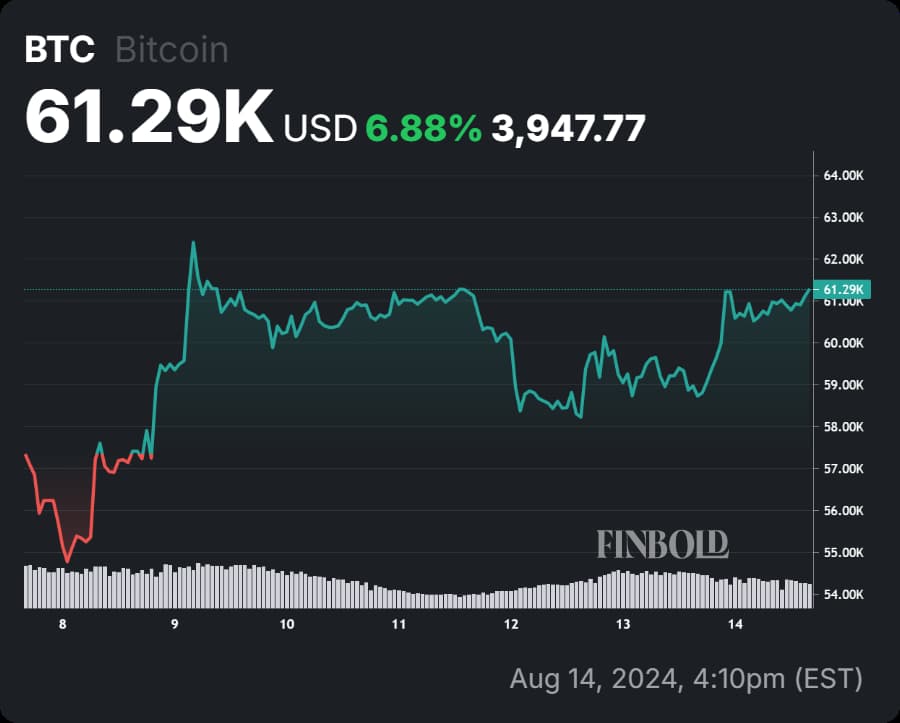
At the time of writing, Bitcoin is trading at $61,240, with a 24-hour gain of over 4%. On the weekly chart, $BTC remains in the green with gains of over 6%.
In conclusion, based on historical patterns, Fibonacci levels, and MACD analysis, the chart suggests that Bitcoin is currently in a consolidation phase that often precedes a significant second rally within the current bull cycle.
If the historical symmetry and time cycles hold true, Bitcoin could reach a price of around $150,000 by mid-2025, with the possibility of even higher gains depending on market dynamics.
Disclaimer:The content on this site should not be considered investment advice. Investing is speculative. When investing, your capital is at risk.