
A Bitcoin triangle formation on the 1-hour chart teases a bull cycle with a breakout run potential. Will this result in a 17% surge to the $68K level?
Bitcoin’s growing volatility in a strictly sideways lane over the last few days seems to have hit an end. With growing underlying demand, the indicators and derivatives market anticipate a bullish outburst will come shortly.
Will this Bitcoin breakout run result in a massive surge beyond $65K? Let’s find out.
Bitcoin’s Changing Dynamics in 1-hour Chart
In the one-hour chart, Bitcoin shows a consolidation move after a price jump to the $61,000 mark. The sideways continuation leads to the formation of two converging trend lines that form a triangle pattern.
Bitcoin is resting at the support trendline and has formed a streak of four bearish candles that accounts for a price drop of 1.30%. However, in the last hour, Bitcoin has recovered 0.20% and is trading at $58,812.
As Bitcoin takes support at the trendline, the chances of a bullish reversal are increasing. Based on the trend-based Fibonacci level, retraced over the recovery rally last week from $49,700 to a peak of $57,470, Bitcoin is taking support at the 50% Fibonacci level at $58,676.
Furthermore, the one-hour RSI line shows a lateral movement near the halfway line slightly below it.
Even the Bollinger bands on the 1-hour timeframe converge, reflecting an increase in tension. Thus, the chances of a sharp move in Bitcoin are increasing.
However, since the consolidation started near the support trend line, the RSI line has revealed a bullish divergence. This increases the possibility of an uptrend continuation and an overhead trend line breakout.
Will Bitcoin’s Breakout Surpass $63K Resistance?
A bullish breakout of the overhead trend line will challenge the 78.60% Fibonacci level at $61,095. In doing so, Bitcoin will reclaim the psychological mark of $60,000. With the additional momentum, the Bitcoin price will likely continue to rally and challenge the peak of $62,970, the 100% Fibonacci level.
Following the breakout, a minor retracement for a retest is possible. The retest can find support at two levels: the 78.60% Fibonacci level at $61,095 or the broken trendline closer to the $60,000 psychological mark.
A post-retest bull run will be the perfect buying opportunity for the sideline traders. The uptrend is likely to surpass $63,000, and a clear path is visible to the $68,713, the 161.80% Fibonacci level.
Derivatives Shift to Bullish Side
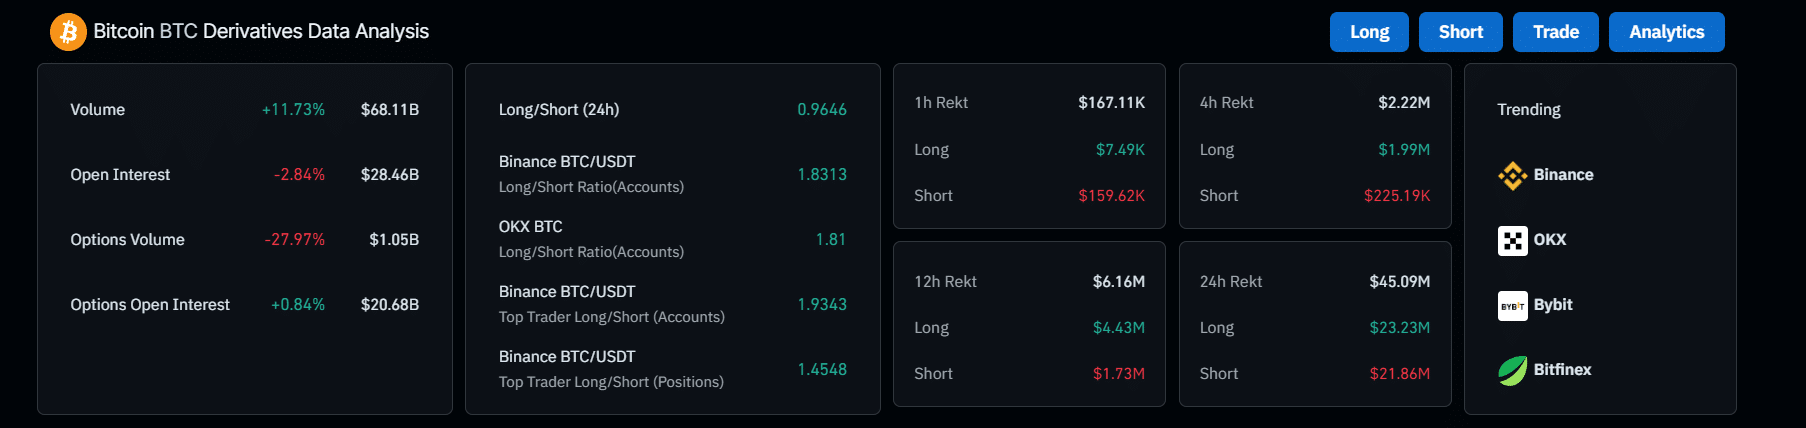
According to recent data from CoinGlass, $159.62K worth of Bitcoin short positions were liquidated in the last hour. In contrast to the $7.49K worth of long liquidation in Bitcoin, liquidation data reveals a stronger bullish side. Hence, the changing dynamics in the derivatives market bolster the possibility of a bullish breakout in Bitcoin.