
Bitcoin’s price on August 12, 2024, stands at $59,777, with intraday 24-hour prices ranging between $57,814 and $61,054. The cryptocurrency’s market capitalization is $1.16 trillion, supported by a 24-hour trade volume of $29.81 billion. As bitcoin navigates this challenging environment, technical indicators reveal continued bearish momentum, testing the resolve of bullish investors.
Bitcoin
The 1-hour chart reveals a pronounced bearish trend, with bitcoin’s price declining from $61,868 to approximately $57,681 since August 11. The significant volume during this downturn underscores the strength of the selling pressure. Currently, bitcoin is consolidating near the $59,000 level, suggesting a possible pause in the downtrend. Traders should watch for a break above this consolidation zone with strong volume as a potential short-term bullish entry, while a fall below $57,681 could indicate further downside.
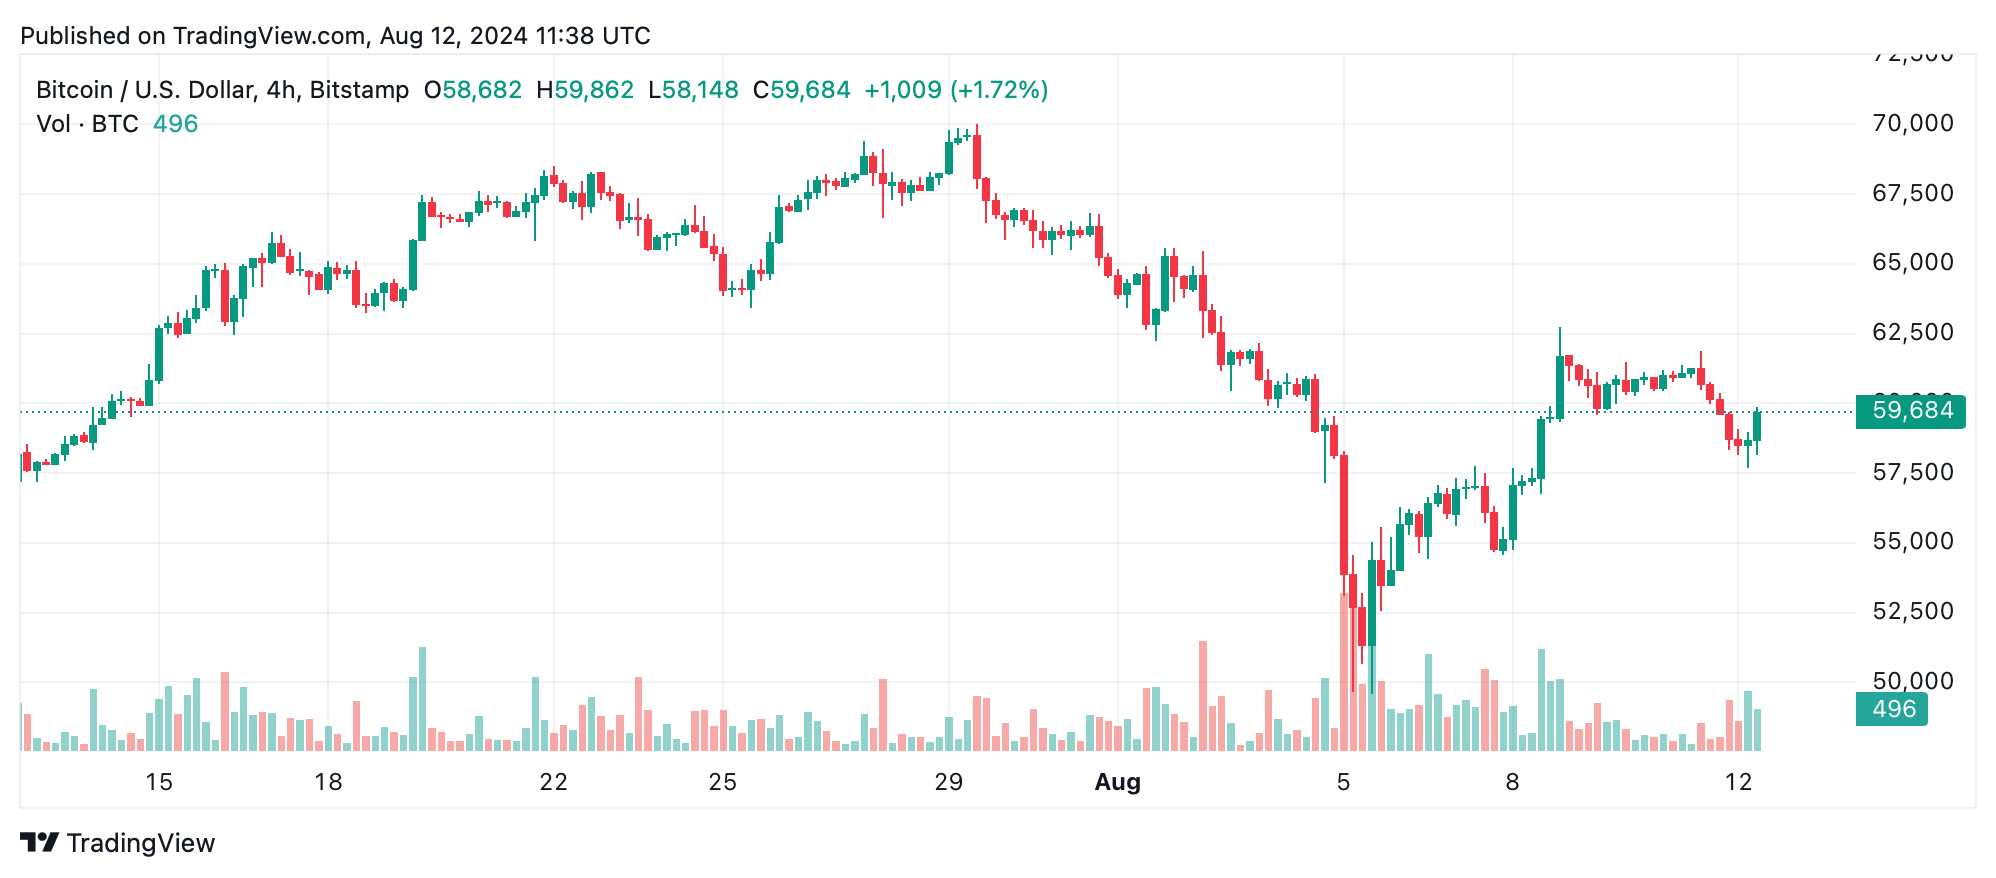
On the 4-hour chart, bitcoin’s broader bearish trend is evident, originating from a high of $62,729 on August 10. The crypto asset has since experienced consistent downward movement, albeit with minor pullbacks. The price is currently testing support around $58,000, with recent ups and downs showing indecision. A break above $60,000 could signal a potential bullish reversal, while a breach below $58,000 with substantial volume would likely confirm continued bearish momentum.
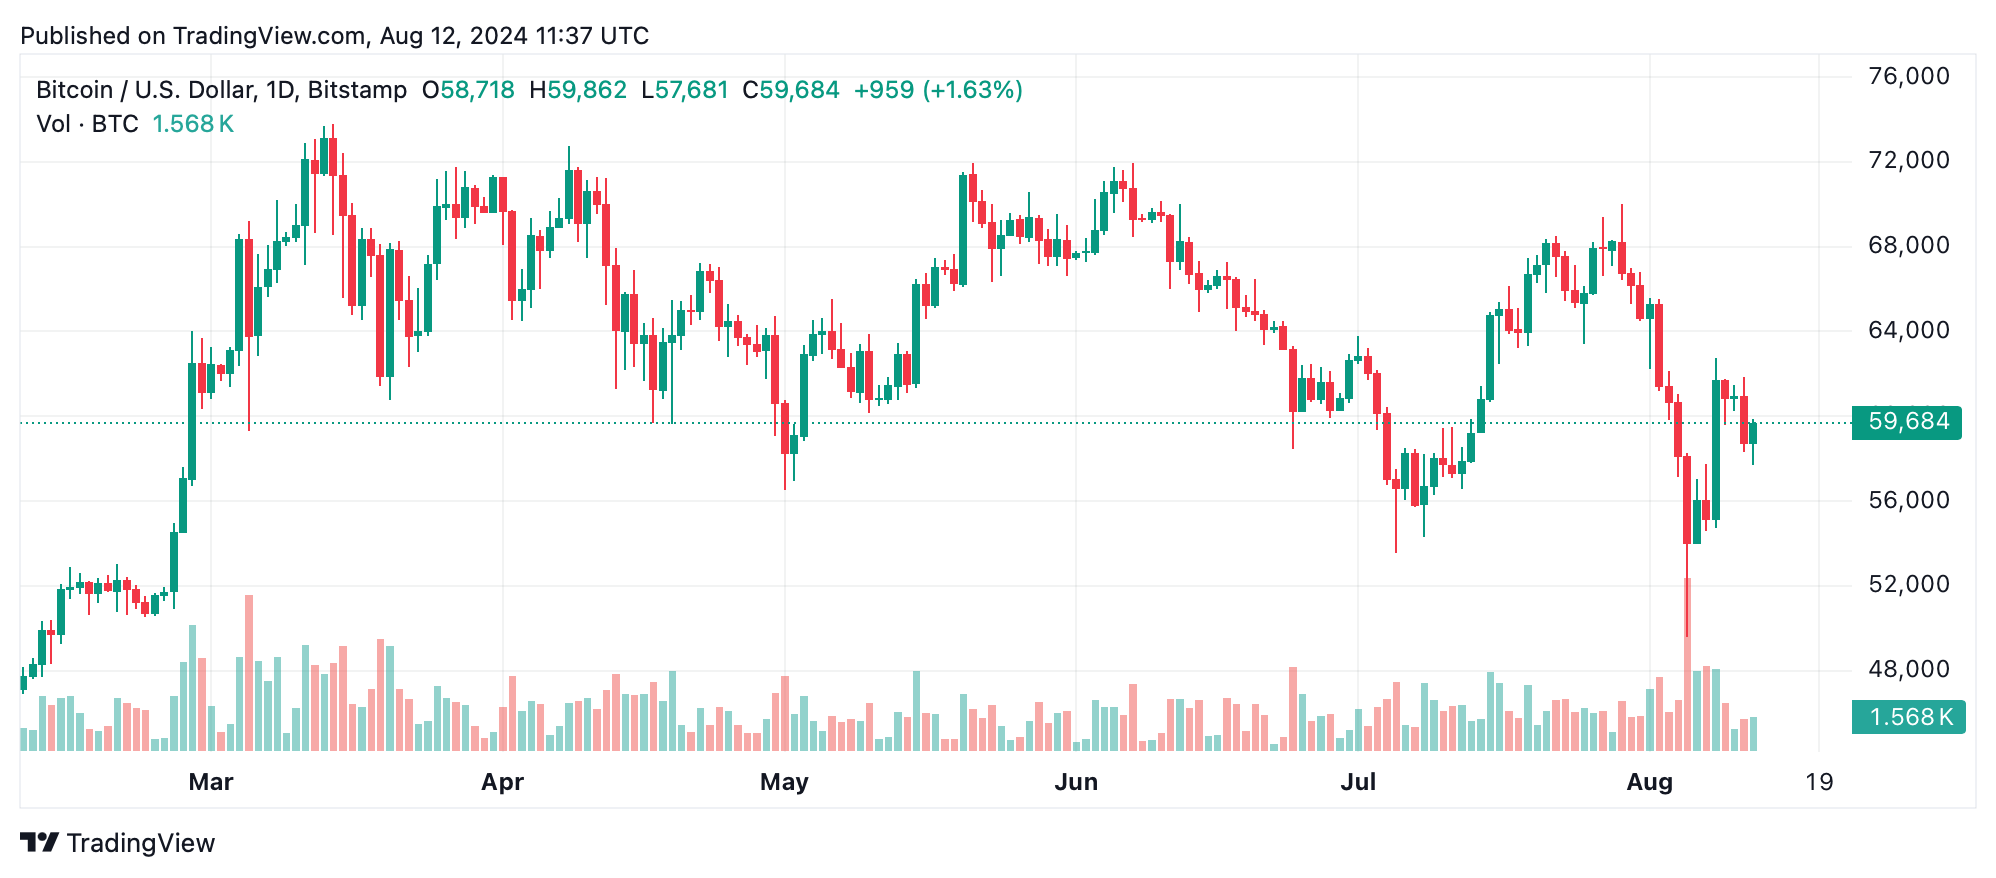
The daily chart provides a broader perspective, showing a significant downtrend from the early August high of $70,016. After a sharp decline to $49,577, bitcoin managed a partial recovery but faced resistance near $62,000. The formation of a potential lower high suggests that the downtrend may persist. Traders should monitor the $62,000 level for a possible bullish breakout, while a break below $57,000 could trigger a deeper decline toward previous lows.
Oscillators are currently neutral, reflecting the ongoing indecision in the market. The relative strength index (RSI) stands at 44, indicating neither overbought nor oversold conditions. Other oscillators, such as the Stochastic, commodity channel index (CCI), and awesome oscillator, also remain neutral, reinforcing the lack of clear directional momentum. However, the Momentum indicator at -2,353 suggests a slight buying interest, while the moving average convergence divergence (MACD) level at -1,328 aligns with the bearish sentiment.
The moving averages (MAs) present a mixed but predominantly bearish outlook. Short-term exponential moving averages (EMAs) of 10, 20, and 30 periods all signal selling pressure, with values of $59,819, $61,004, and $61,642, respectively. The simple moving average (SMA) for 10 periods offers a glimmer of hope with a buy signal at $58,530, but longer-term averages (50, 100, and 200 periods) remain in sell territory. The overall trend suggests that bitcoin may continue to face downward pressure unless it can break through key resistance levels.
Bull Verdict:
For bullish traders, bitcoin’s consolidation near $59,000 and potential break above key resistance levels like $60,000 and $62,000 offer glimmers of hope. A confirmed breakout with strong volume could signal a reversal of the current downtrend, paving the way for a recovery toward previous highs. However, caution is advised until these levels are definitively breached.
Bear Verdict:
The bearish outlook remains strong, with bitcoin consistently facing resistance and struggling to hold critical support levels. The dominance of sell signals across most moving averages and the failure to regain momentum above $62,000 suggest that further downside is likely. A break below $57,000 could accelerate the decline, potentially leading to a retest of August’s lows around $49,577.