Bitcoin price fell as low as $49,111 on Monday Aug, 5, three technical price indicators suggest $BTC is now headed for an imminent bullish reversal as the month unfolds.
$BTC Rebounds 16% after Monday Bloodbath
The global crypto markets suffered extreme turmoil on Monday Aug 5, with Bitcoin price experiencing its worst 7-day timeframe since in 2-years. Despite bullish catalyst from the US Fed hinting at rate cut in September, several bearish catalysts unfolded within a short-term window.
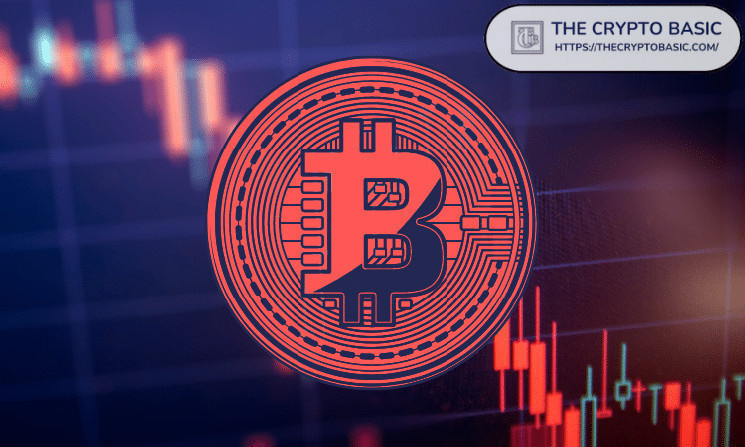
Looking at the chart above, we see how Bitcoin price declined 29.77% between July 29 and Aug 5. Notably, the last time Bitcoin experienced this level of negative price action was during the FTX crash in 2022.
Evidently the $BTC price crash was largely exacerbated by the $700 million liquidations in the derivatives market which saw highly leveraged traders book historic losses. However, Bitcoin price has now made a rapid 16.68% recovery from the dramatic plunge recorded on Monday, to reclaim the $57,550 mark at the time of writing on Aug 7.
This suggest that strategic traders are capitalized on the market dip to bolster their $BTC holdings at a discount. 3 technical market indicators suggest that this buying spree could propel Bitcoin price towards the $70,000 mark.
1. Balance of Power suggests Buyers in Control
The Balance of Power (BOP) indicator is a technical analysis tool used to measure the strength of buying and selling pressure in the market. It calculates the difference between the high and low prices for each period and oscillates around a zero line. When the BOP indicator has a positive value, it suggests that there is buying pressure, and when it has a negative value, it indicates selling pressure. This information can be valuable for traders and investors to gauge market sentiment and potential price movements.
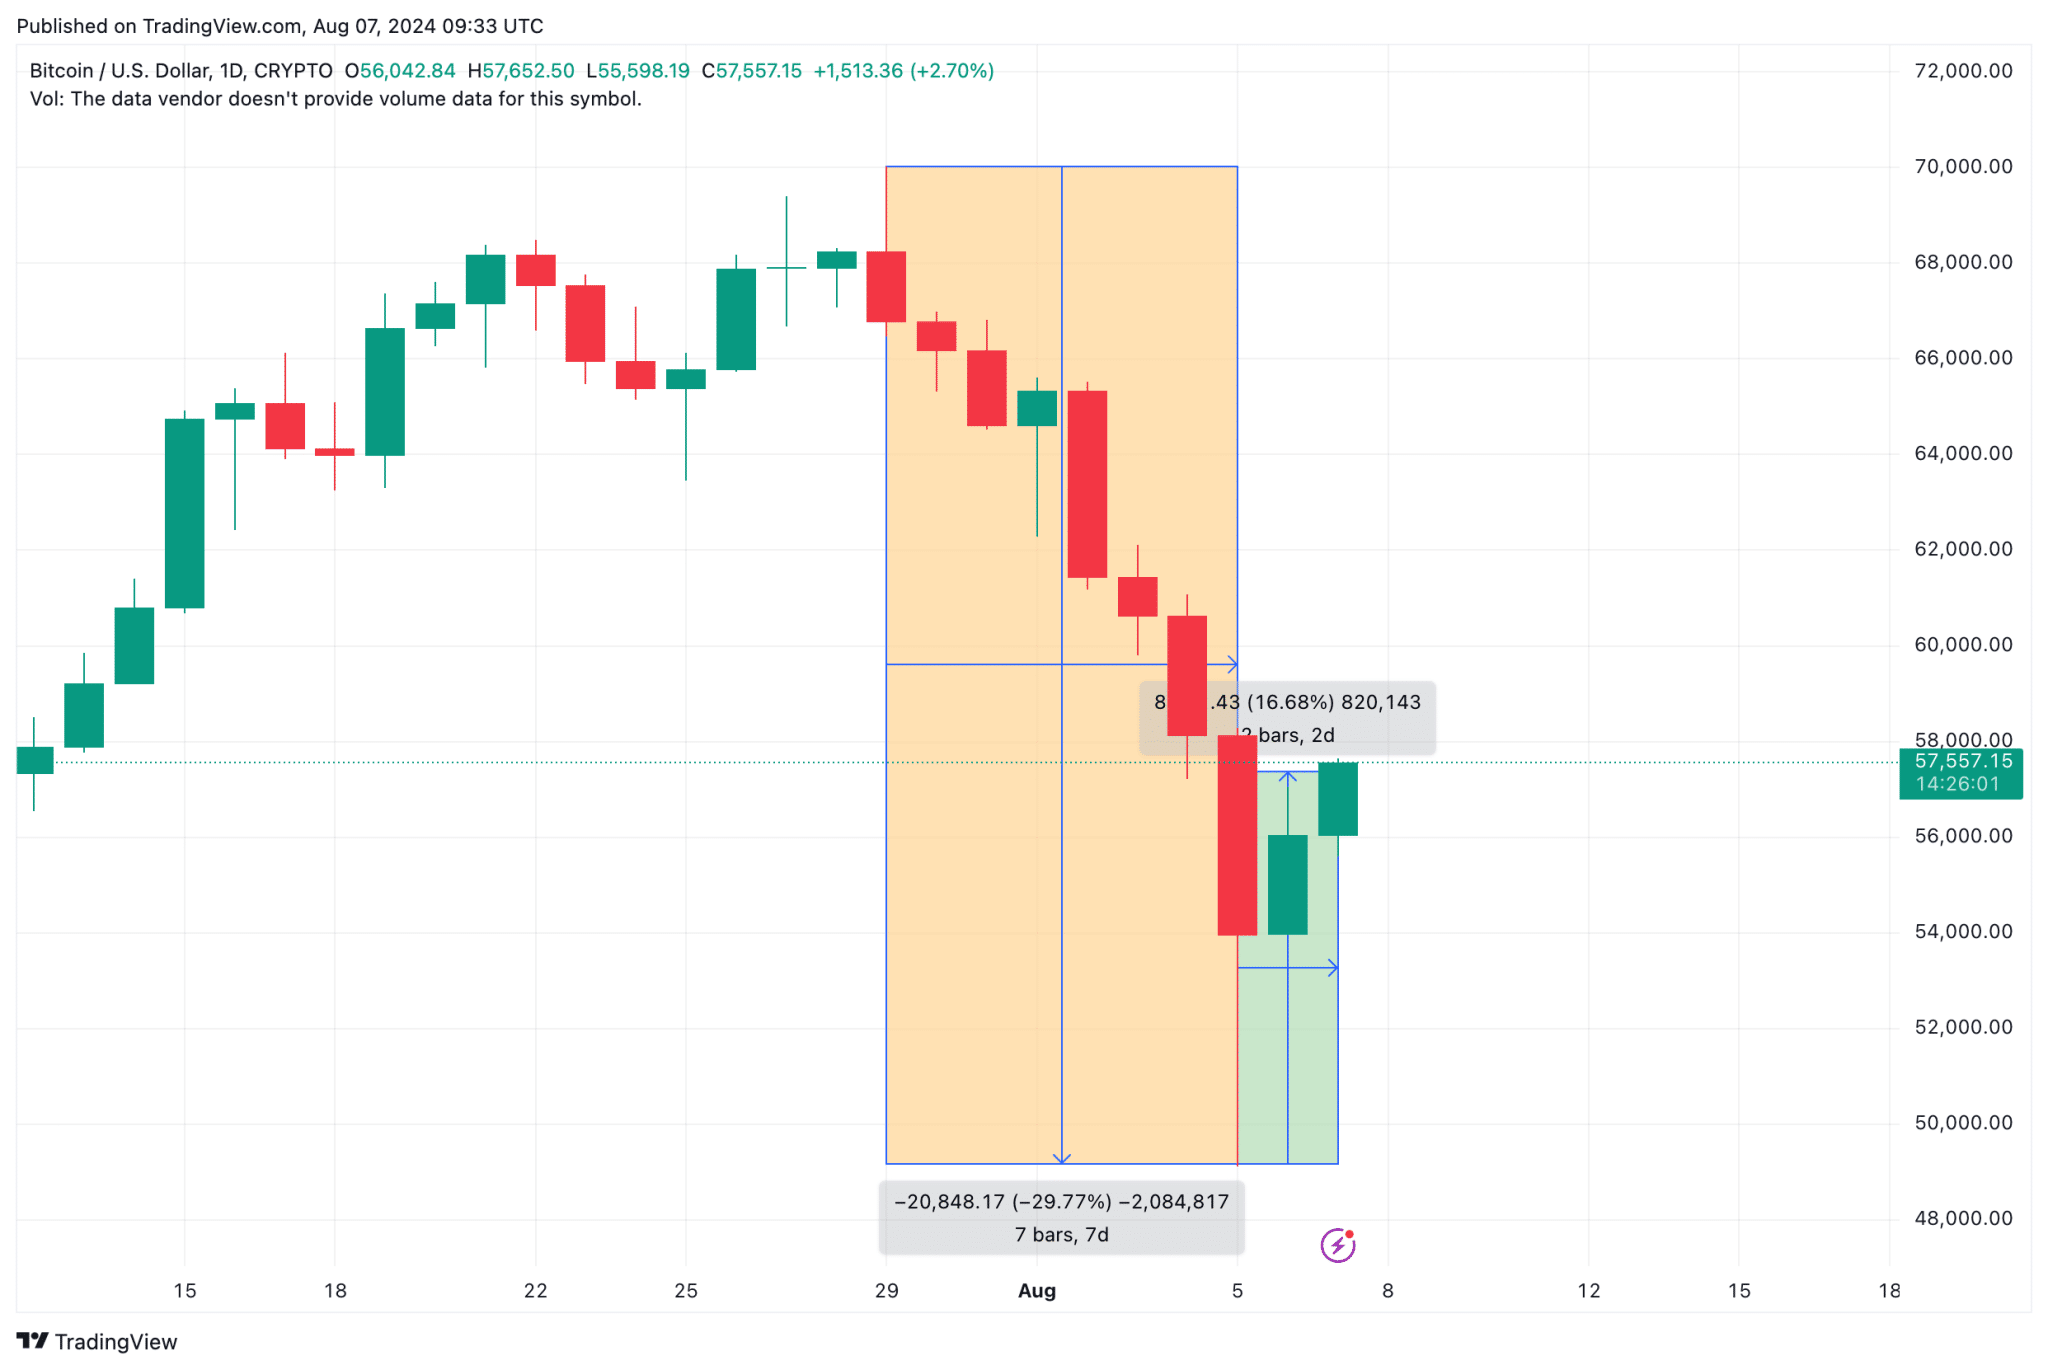
On the $BTC/USD daily chart, the BOP is currently trending at 0.68, which is relatively high. This suggests that buyers are currently in control, which can be interpreted as a bullish signal for Bitcoin.
A high BOP value, especially after a period of declining prices, could be a prime indicator of fatigue among sellers as buyers step in, potentially leading to a prolonged upward Bitcoin price momentum in August 2024.
2. ADL Flashes Bullish Advance Signals
The Advance Decline Line (ADL) is another key indicator flashing bullish signals for Bitcoin price action. This indicator tracks the cumulative difference between advancing and declining assets. Typically, a rising ADL suggests that asset price is advancing more intensely than it is declining, indicating overall market strength.
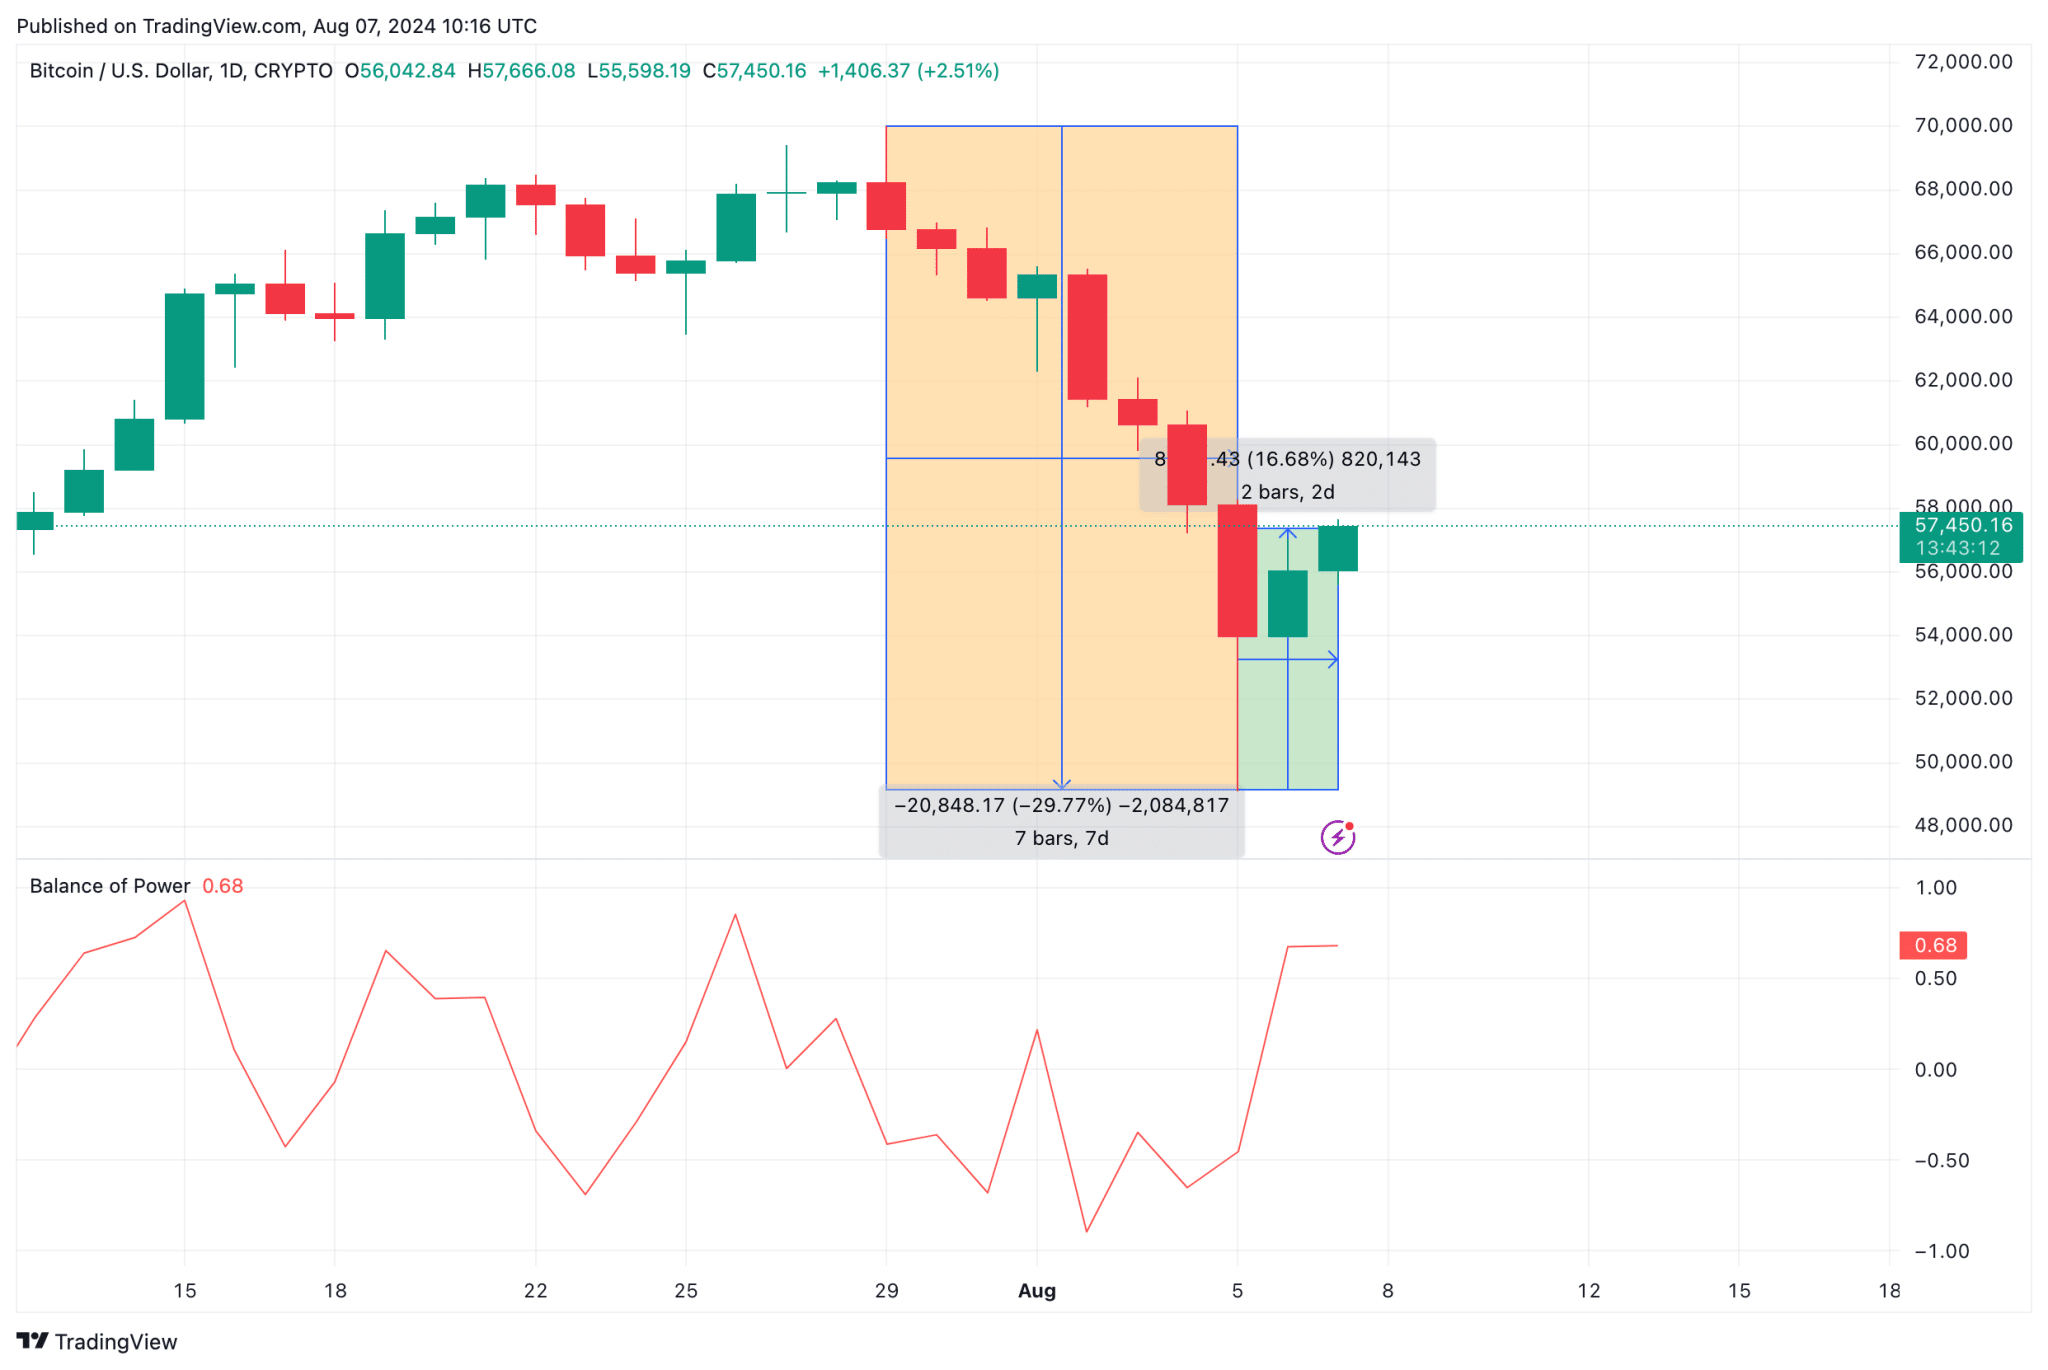
As seen in the chart above, the ADL is currently around 1,515.54, which is on an upward trajectory. This positive movement in the ADL indicates that there are more advancing issues than declining ones in the market, suggesting broad-based buying interest.
For Bitcoin, this broad market strength can be a bullish signal as it reflects positive investor sentiment and a potential for further price increases as more assets participate in the uptrend.
3. $BTC Price Forecast: Bollinger Bands Show Key Resistance at $59,500
Bitcoin ($BTC) has experienced a notable rebound over the past two days, climbing 16.68% from a low of $55,598.19 to the current level of $57,586.78 as of August 7, 2024. This recovery follows a sharp decline, where $BTC lost nearly 30% in the preceding week. Technical indicators now suggest a potential shift in market sentiment.
The Bollinger Bands, a volatility indicator, reveal key resistance at $59,500. This resistance level coincides with the upper band, which $BTC needs to break through to confirm a bullish continuation.
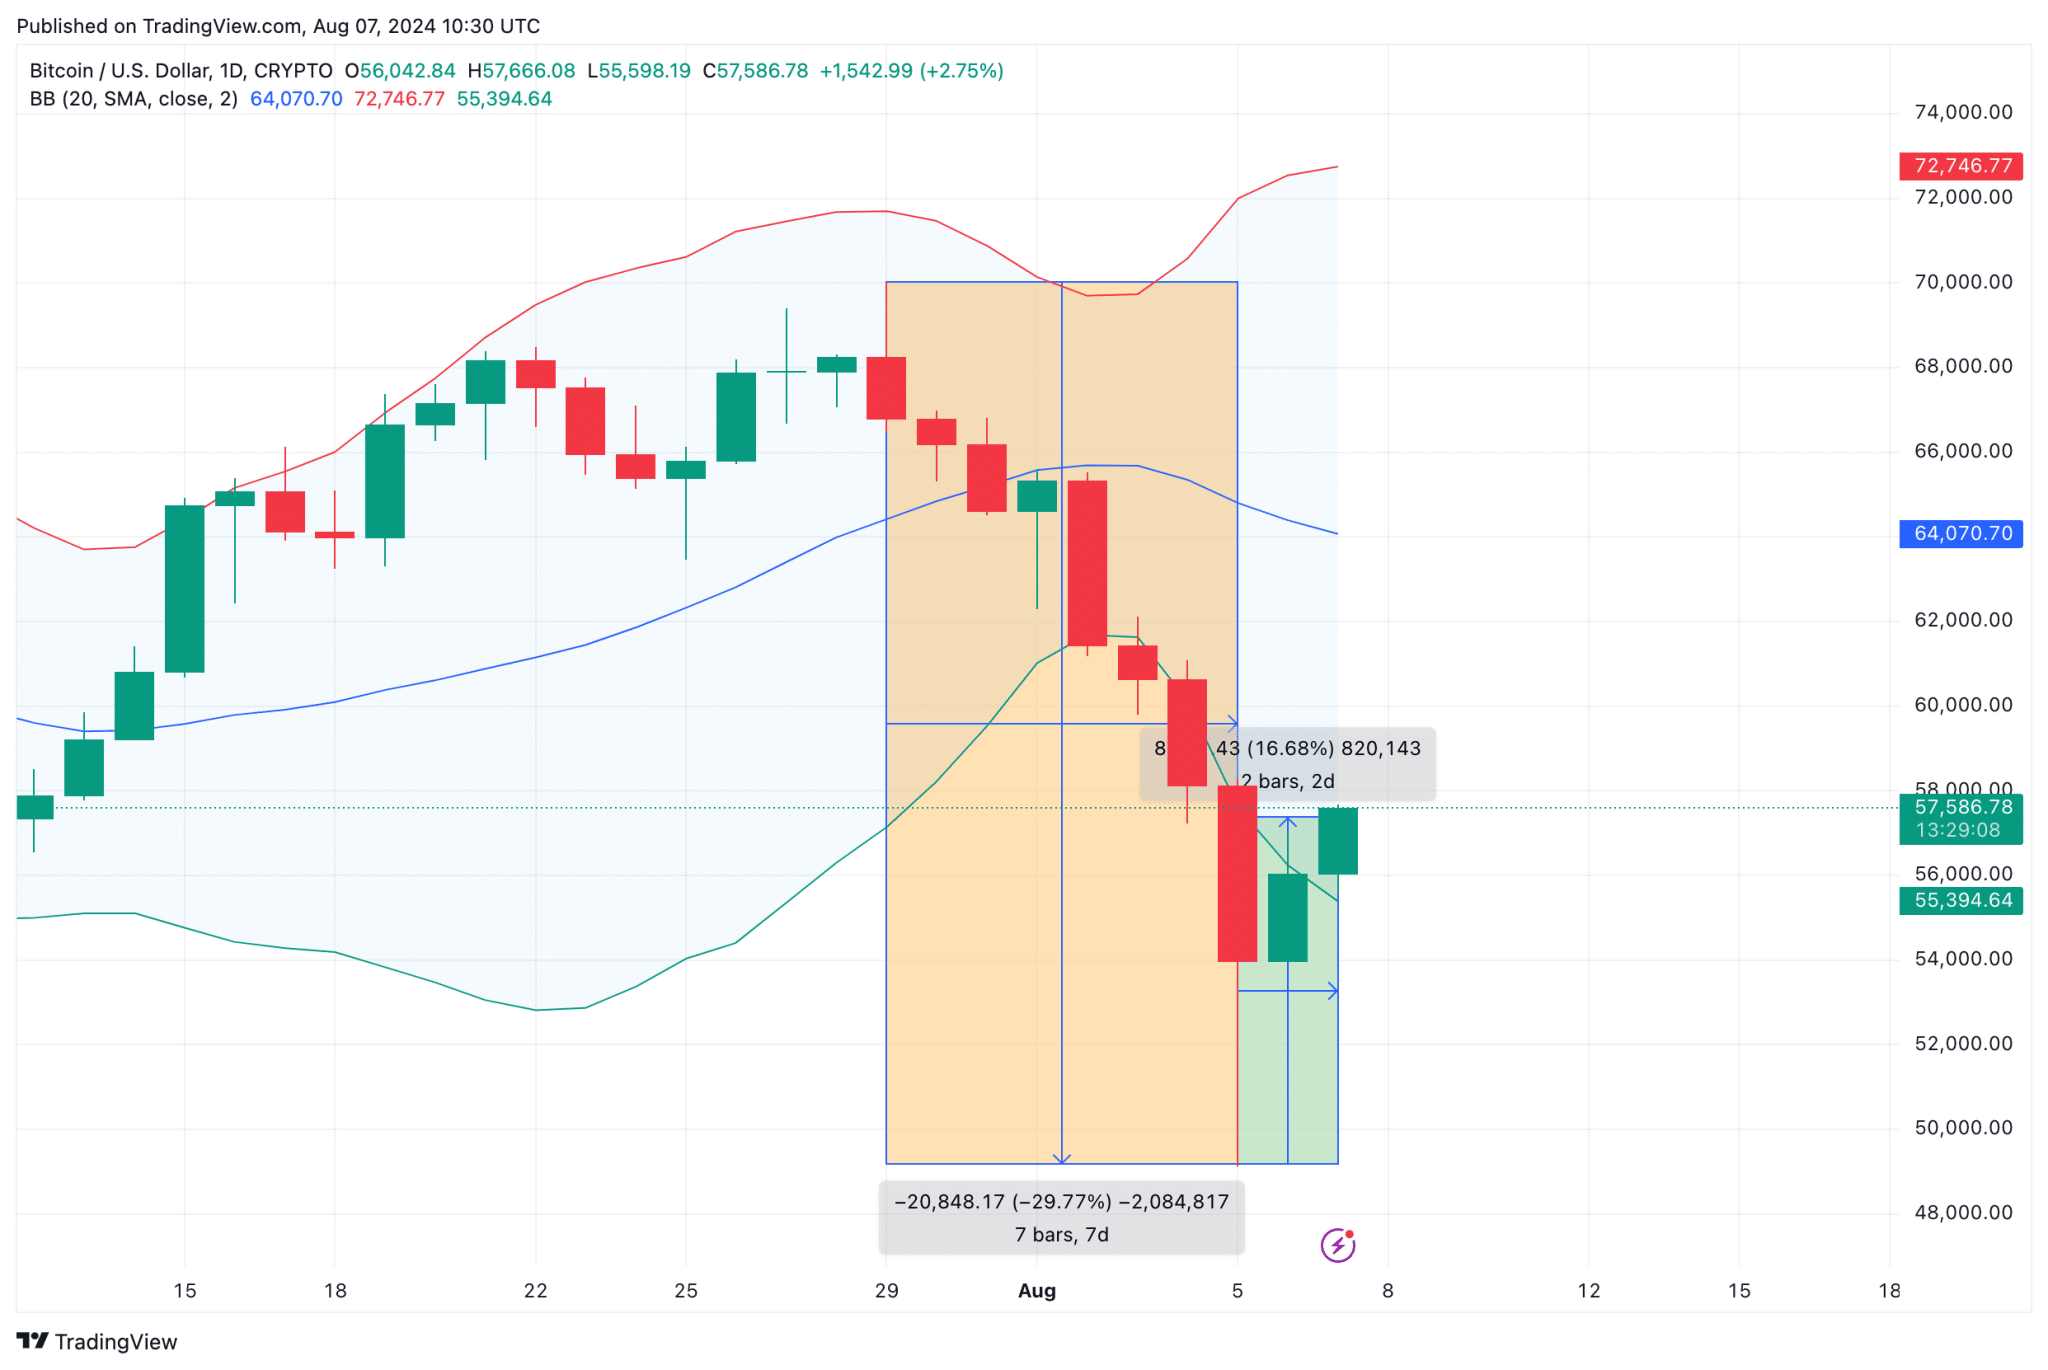
The middle band, around $64,070.70, serves as a secondary resistance, aligning with the 20-day simple moving average (SMA). A successful break above these levels could propel $BTC towards the $72,746.77 mark, the upper extreme of the Bollinger Bands.
On the support side, the lower Bollinger Band at $55,394.64 acts as a critical level to watch. If $BTC fails to sustain its current rally, a drop below this support could signal a return to bearish sentiment, with potential downside targets around $50,000.
However, the recent price action suggests bullish momentum is building, provided $BTC can maintain support above the $55,394 lower band.