
Bitcoin’s price reached a five-month low, dipping to $49,647 at 2:25 a.m. EDT on Monday, Aug. 5. This decline is fueled by growing concerns about an impending recession, with Japan’s Nikkei experiencing its steepest daily drop since ‘Black Monday’ in 1987. Futures for the Dow, Nasdaq, and S&P 500 have also shown signs of correction, signaling that when U.S. markets open, a significant downturn is likely in the cards.
Bitcoin
On August 5, 2024, bitcoin’s price action displayed significant bearish momentum across multiple timeframes. Despite attempts at consolidation around the $50,000 mark, technical indicators suggest that further downside could be imminent. The 1-hour chart for bitcoin reveals a sharp decline from $61,073 to a low of $49,647, indicating a steep downtrend. While the price has shown some signs of stabilizing near the $50,000 level, the short-term outlook remains bearish. Volume analysis on the 1-hour chart indicates a slight reduction in selling pressure, but this does not necessarily imply a reversal.
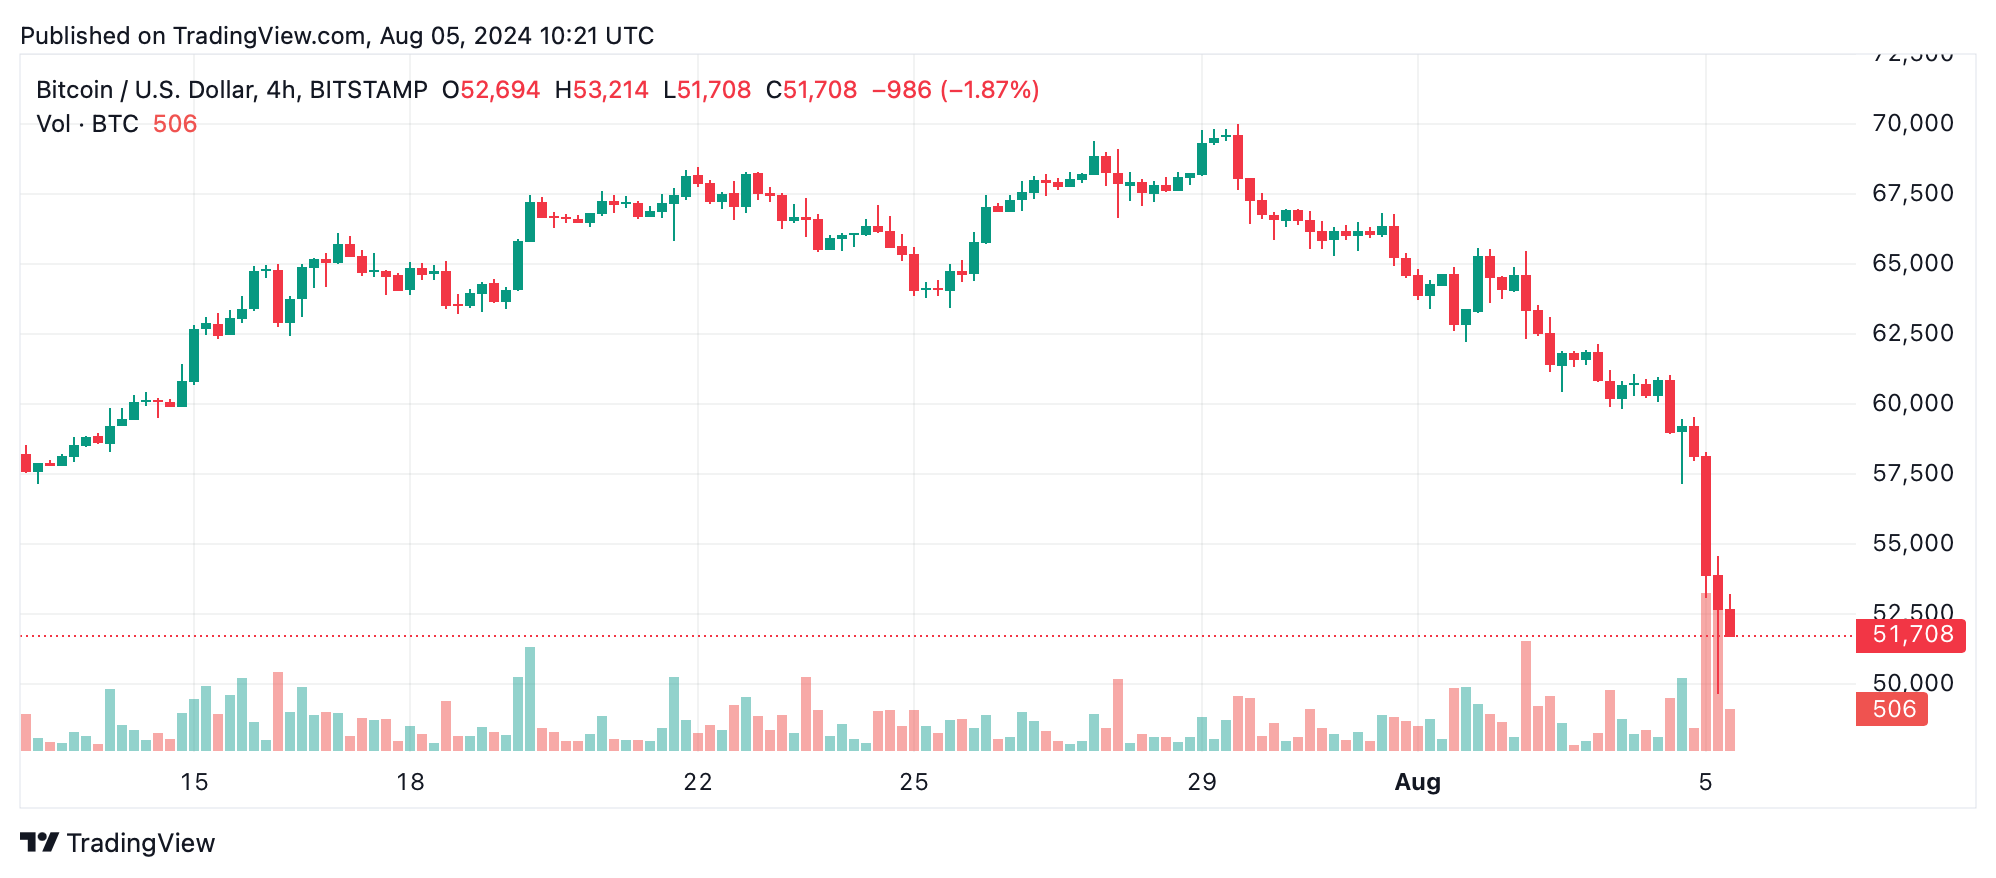
Examining the 4-hour chart, the bearish trend is even more pronounced, with a consistent pattern of lower highs and lower lows. The rapid sell-off from $66,814 to $49,647 within a short span underscores the intense selling pressure. While there have been minor attempts at recovery, these have been weak and may represent a “dead cat bounce” rather than a sustainable reversal.
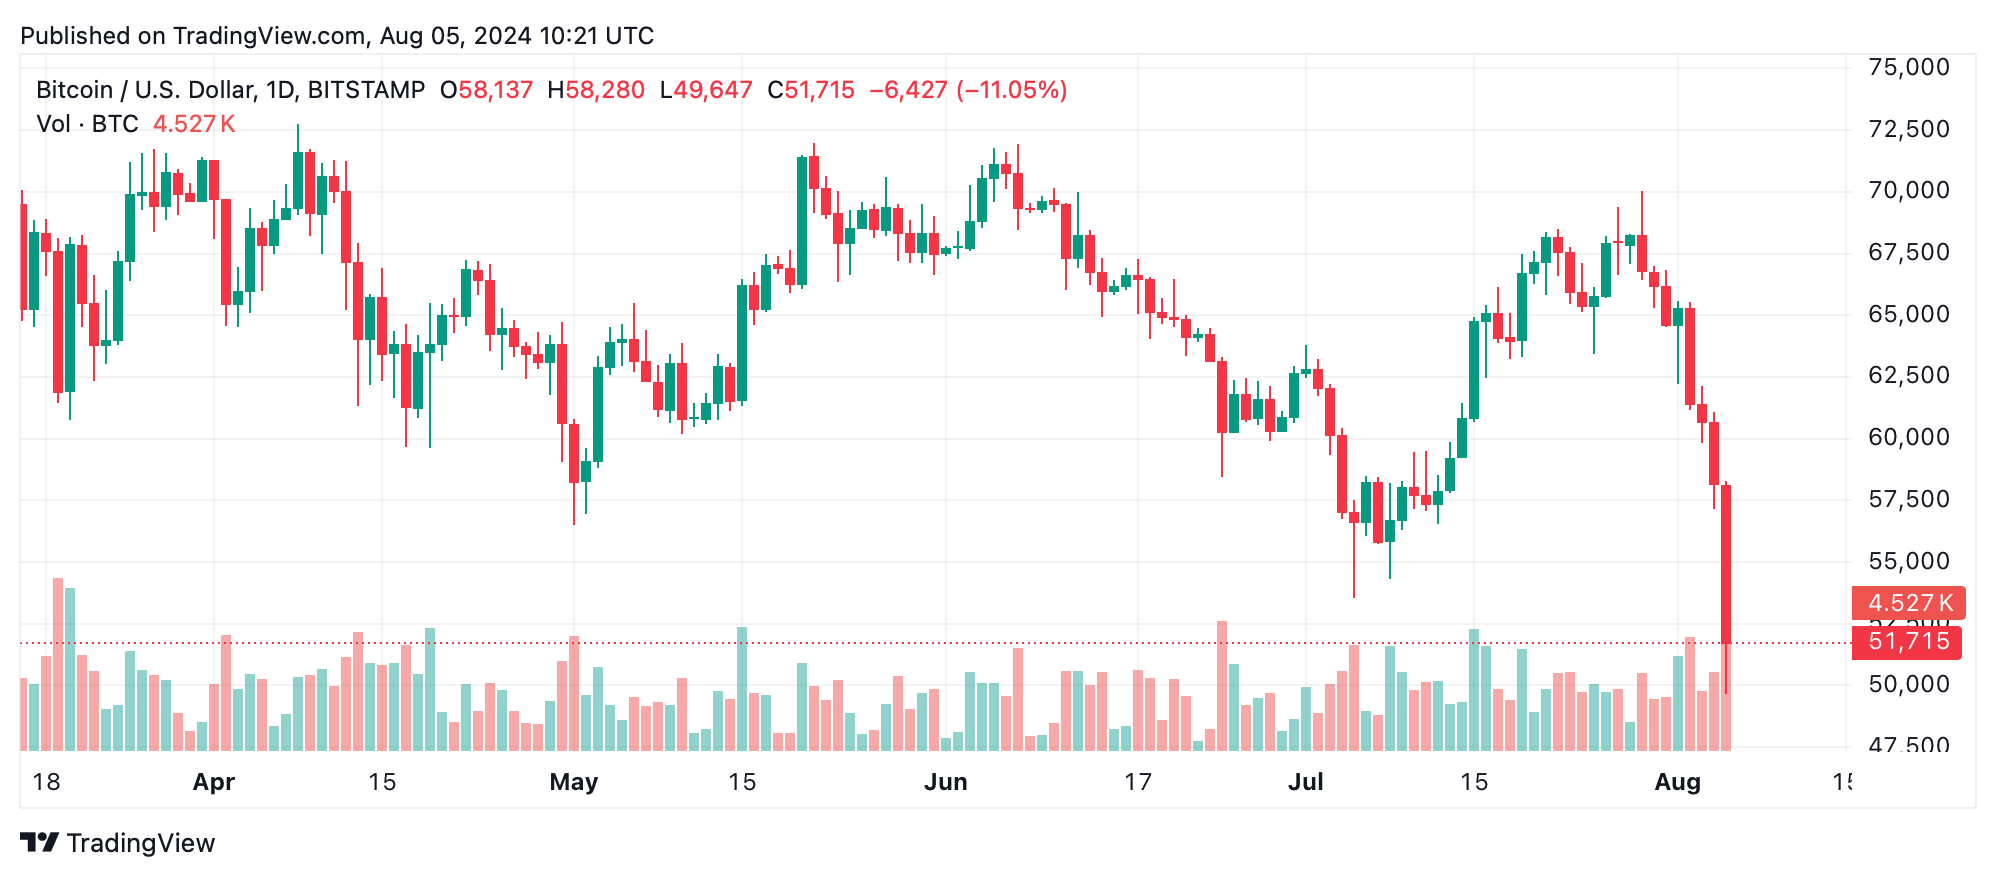
The daily chart further confirms the bearish momentum with a steep decline from previous highs of around $70,000 last week. The price has recently closed near $49,647, significantly below several key support levels. The increase in red volume bars, coupled with large downturns, suggests panic selling or liquidation. If the critical support at $50,000 fails to hold, bitcoin could see further declines towards the next support zone between $45,000 and $48,000.
Oscillator analysis paints a mixed picture, with most indicators presently showing neutral signals. The relative strength index (RSI) is at 25, indicating oversold conditions, which could hint at a potential reversal if buying interest returns. However, momentum indicators like the moving average convergence divergence (MACD) and awesome oscillator are in the sell zone, reflecting the prevailing downward pressure. This divergence suggests that while the market may be technically oversold, the bearish momentum has not yet been fully exhausted.
Moving averages (MAs) across all key timeframes are firmly in the sell category, reinforcing the bearish outlook. Both the short-term and long-term moving averages, including the 10-day, 20-day, 50-day, and 200-day, are positioned well above the current price, which is a clear negative signal. Until bitcoin can break above these moving averages, any rallies may be short-lived, with the overall market sentiment remaining negative.
Bull Verdict:
Despite the prevailing bearish sentiment, the oversold conditions indicated by the RSI and potential consolidation around the $50,000 mark could lead to a short-term rebound. If bitcoin manages to hold this critical support and break above the $54,000 resistance, a recovery toward higher levels could be on the horizon.
Bear Verdict:
The strong bearish momentum, reinforced by consistent sell signals across moving averages and momentum indicators, suggests that further downside is likely. If bitcoin fails to maintain support at $50,000, the price could continue to decline, potentially reaching the $45,000 – $48,000 range before finding a new support level.