
As Bitcoin ($BTC) establishes its price above the $67,000 mark, an analyst has observed that the crypto is destined for another all-time high based on fundamental technical indicators.
In an analysis shared on X on July 26, Trader Tardigrade predicted that Bitcoin is destined for $90,000 after confirming a key bullish crossover on the moving average convergence divergence (MACD) indicator.
According to the analyst, the Bitcoin chart outlines crucial insights aligning with the bullish sentiment. The MACD indicator, a popular tool traders use to identify potential market trends, has signaled a possible shift in momentum from bearish to bullish.
“Bitcoin MACD Bullish Crossover confirmed. $BTC 3-day chart shows a Bullish Crossover on MACD indicator. This represents an Uptrend Momentum has been developed and could bring to a new Surge soon,” the expert said.
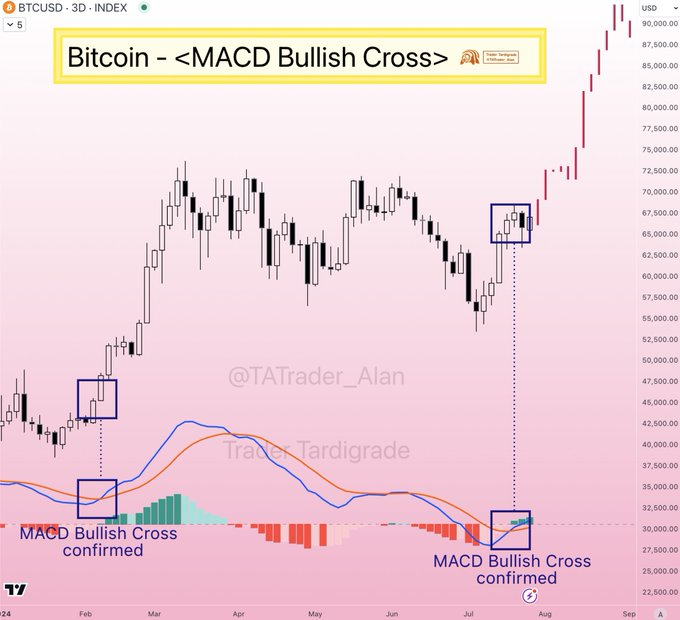
The first crossover occurred in early February, leading to a notable surge in Bitcoin’s price. The current crossover, confirmed in late July, suggests that Bitcoin may be on the cusp of another major rally, with $90,000 remaining a potential target. Historically, such crossovers have been reliable indicators of upward price movement, giving traders and investors a reason for optimism.
As of the last MACD bullish cross, Bitcoin’s price was around $32,000. If the historical pattern holds true, this crossover could propel Bitcoin toward the projected target, representing a nearly threefold increase in value.
Notably, a rise to $90,000 would reaffirm Bitcoin’s position and bolster investor confidence across the entire digital asset market.
Bitcoin facing minor pullback
Indeed, the market is watching Bitcoin’s ability to push towards the $70,000 mark, as this position would likely validate any possible move towards a new all-time high. In the short term, another crypto analyst, Ali Martinez, has suggested that Bitcoin might face a minor pullback before rallying.
In an X post on July 26, Martinez noted that the TD Sequential indicator had presented a sell signal on the Bitcoin hourly chart. This technical signal, known for its ability to predict market reversals, suggests that a brief correction in Bitcoin’s price is imminent before it potentially reaches higher highs.
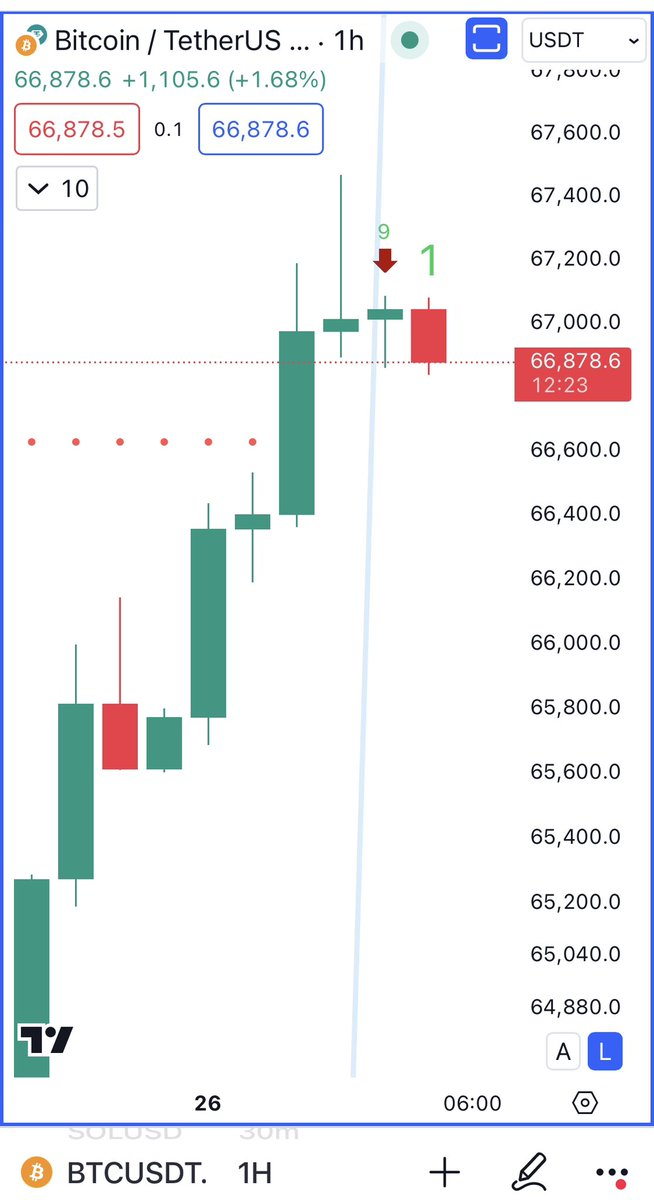
Notably, the TD Sequential identifies trend exhaustion and possible price reversals. The current signal indicates that Bitcoin may experience a short-term dip, offering a potential buying opportunity for those looking to capitalize on lower entry points.
Additionally, Bitcoin’s price growth potential is deemed to be progressive in the coming months. In particular, according to a Finbold report, the Market Value to Realized Value (MVRV) and Network Value-to-Transaction (NVT) analysis shows favorable price growth for Bitcoin.
Bitcoin price analysis
At the time of reporting, Bitcoin was trading at $67,190, with daily gains of over 4%. Over the past seven days, it has been up 2%.
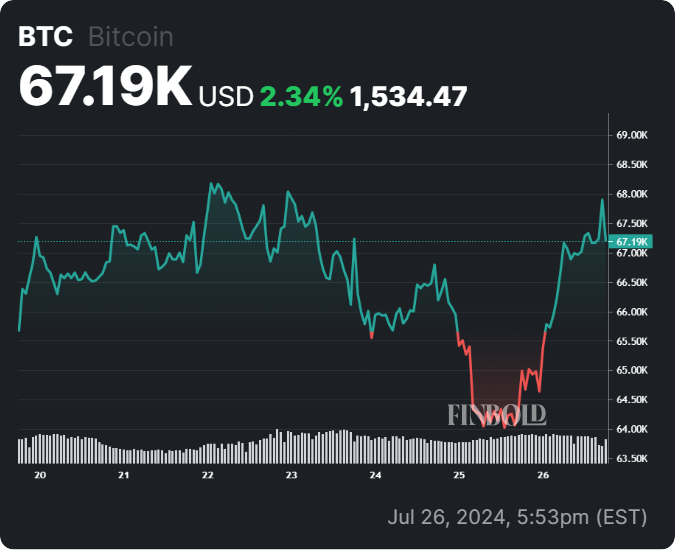
Overall, Bitcoin has established bullish momentum in the short term, and reclaiming $70,000 will likely be key in targeting a new high.
Disclaimer: The content on this site should not be considered investment advice. Investing is speculative. When investing, your capital is at risk.