
Bitcoin’s price stands at $57,206, with an intraday 24-hour range between $54,296 and $58,441. The market capitalization is $1.12 trillion, and the 24-hour trade volume reaches $33.69 billion.
Bitcoin
Bitcoin’s 1-hour chart shows a recent downtrend from $58,441 to $54,296, followed by a sharp recovery to approximately $57,500. The support level is firmly established at $54,296, while resistance is noted at $58,441. A significant increase in trading volume during the upward movement suggests strong buying interest at lower levels, indicating a potential short-term rally.
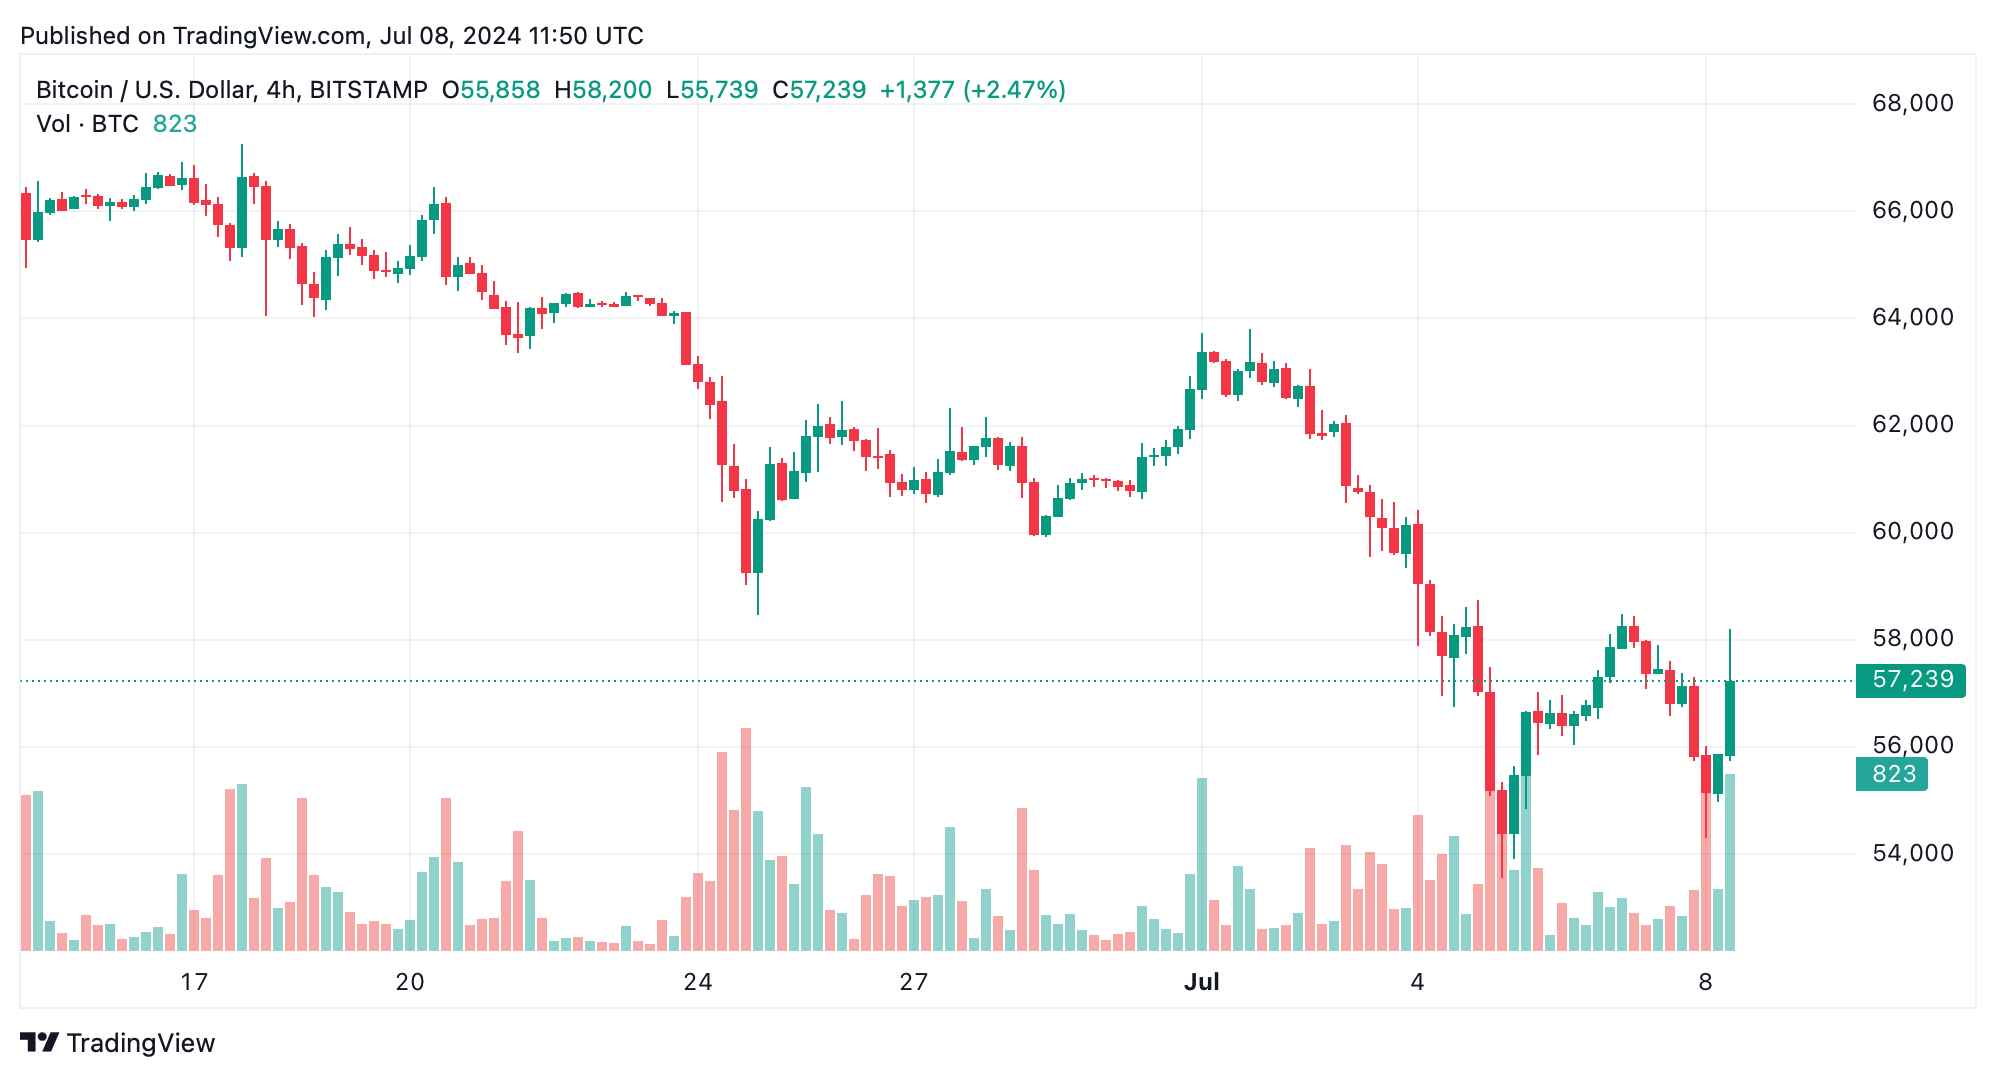
On the 4-hour chart, bitcoin has experienced a notable downtrend from $62,196 to $53,550, followed by a gradual recovery to around $57,000. This timeframe also exhibits increased volume during the recovery phase, pointing to accumulation among buyers. Key support is identified at $53,550, with resistance at $62,196, suggesting cautious optimism among traders.
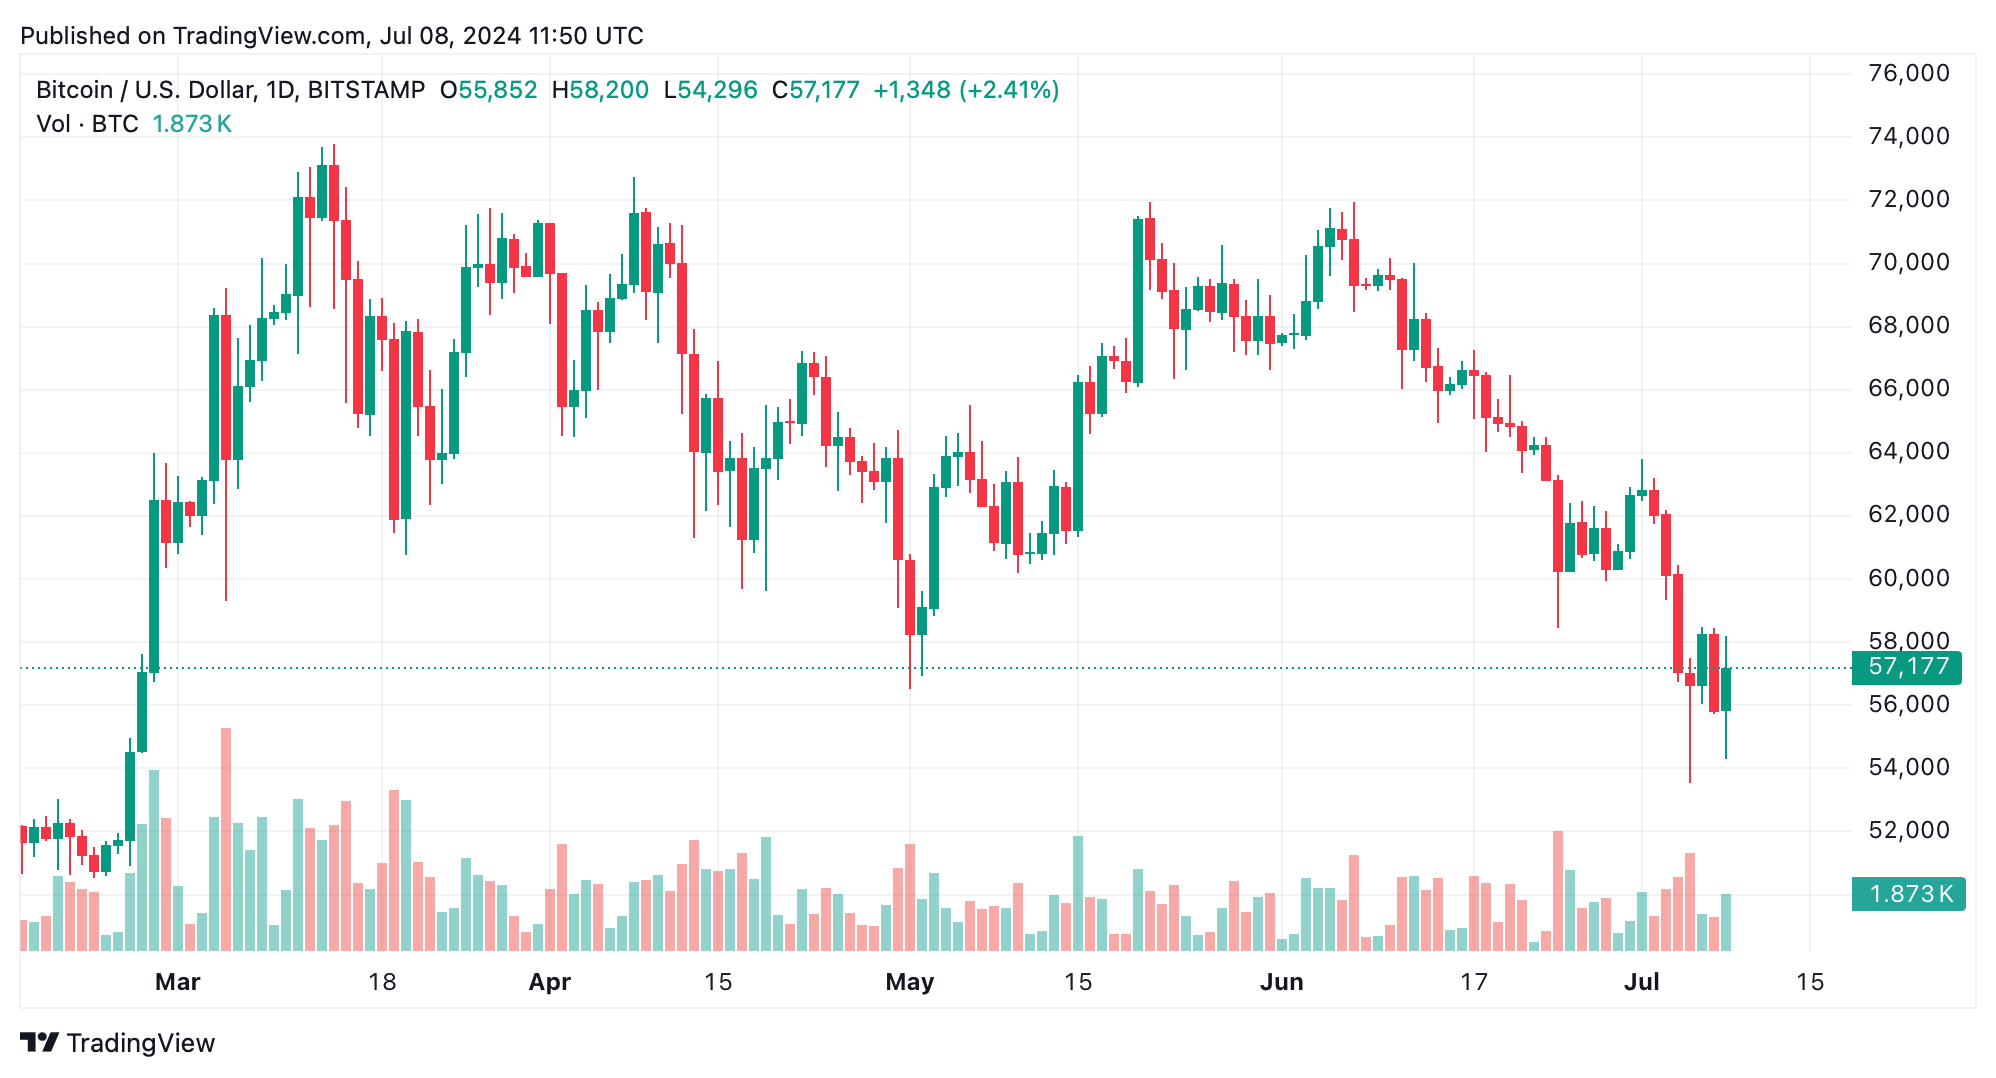
The daily chart reveals a long-term downtrend from $71,949 to $53,550, with multiple recovery attempts. Rock bottom support is still solid at $53,550, while resistance levels at $62,000 and $71,949 remain. Volume spikes during the latest sell-offs and recoveries indicate periods of heightened trading activity, reflecting market participants’ responses to significant price changes.
Oscillators present a mixed outlook: the relative strength index (RSI) at 36 and Stochastic at 34 both signal neutral stances. The commodity channel index (CCI) at −136 suggests a buying opportunity, whereas the moving average convergence divergence (MACD) level at −2335 indicates a sell signal. The awesome oscillator and momentum readings are neutral and buy respectively, reflecting uncertainty in market sentiment.
Moving averages (MAs) uniformly suggest bearish trends across various periods. The exponential moving averages (EMAs) and simple moving averages (SMAs) for 10, 20, 30, 50, 100, and 200 periods all indicate sell signals. This uniform bearishness in moving averages highlights the prevailing negative sentiment and potential further downside risk.
Bull Verdict:
Despite the prevailing bearish signals, the significant volume spikes during upward movements and recoveries suggest the potential for a bullish reversal. If support levels hold and buying interest continues at lower prices, bitcoin could see a positive turnaround in the near future.
Bear Verdict
The consistent bearish signals from MAs and the overall downtrend across multiple timeframes indicate a continued downward pressure. Traders should be cautious as the prevailing sentiment and technical indicators suggest further downside risk in the near term.