
Bitcoin’s market activity on July 5, 2024, has been marked by a persistent downtrend across various time frames, with the price currently at $55,338. Over the past 24 hours, Bitcoin’s price has ranged between $53,550 and $58,673, with a market capitalization of $1.08 trillion and a 24-hour trade volume of $54 billion.
Bitcoin
Bitcoin’s 1-hour chart reveals a notable downtrend from $60,430 to a low of approximately $53,550, followed by a minor recovery. Trading volume spiked significantly at the recent low, indicating strong buying interest at lower prices. The key support level is identified at $53,550, with resistance around $55,000. The upswing formation, post the low, suggests a potential short-term reversal.
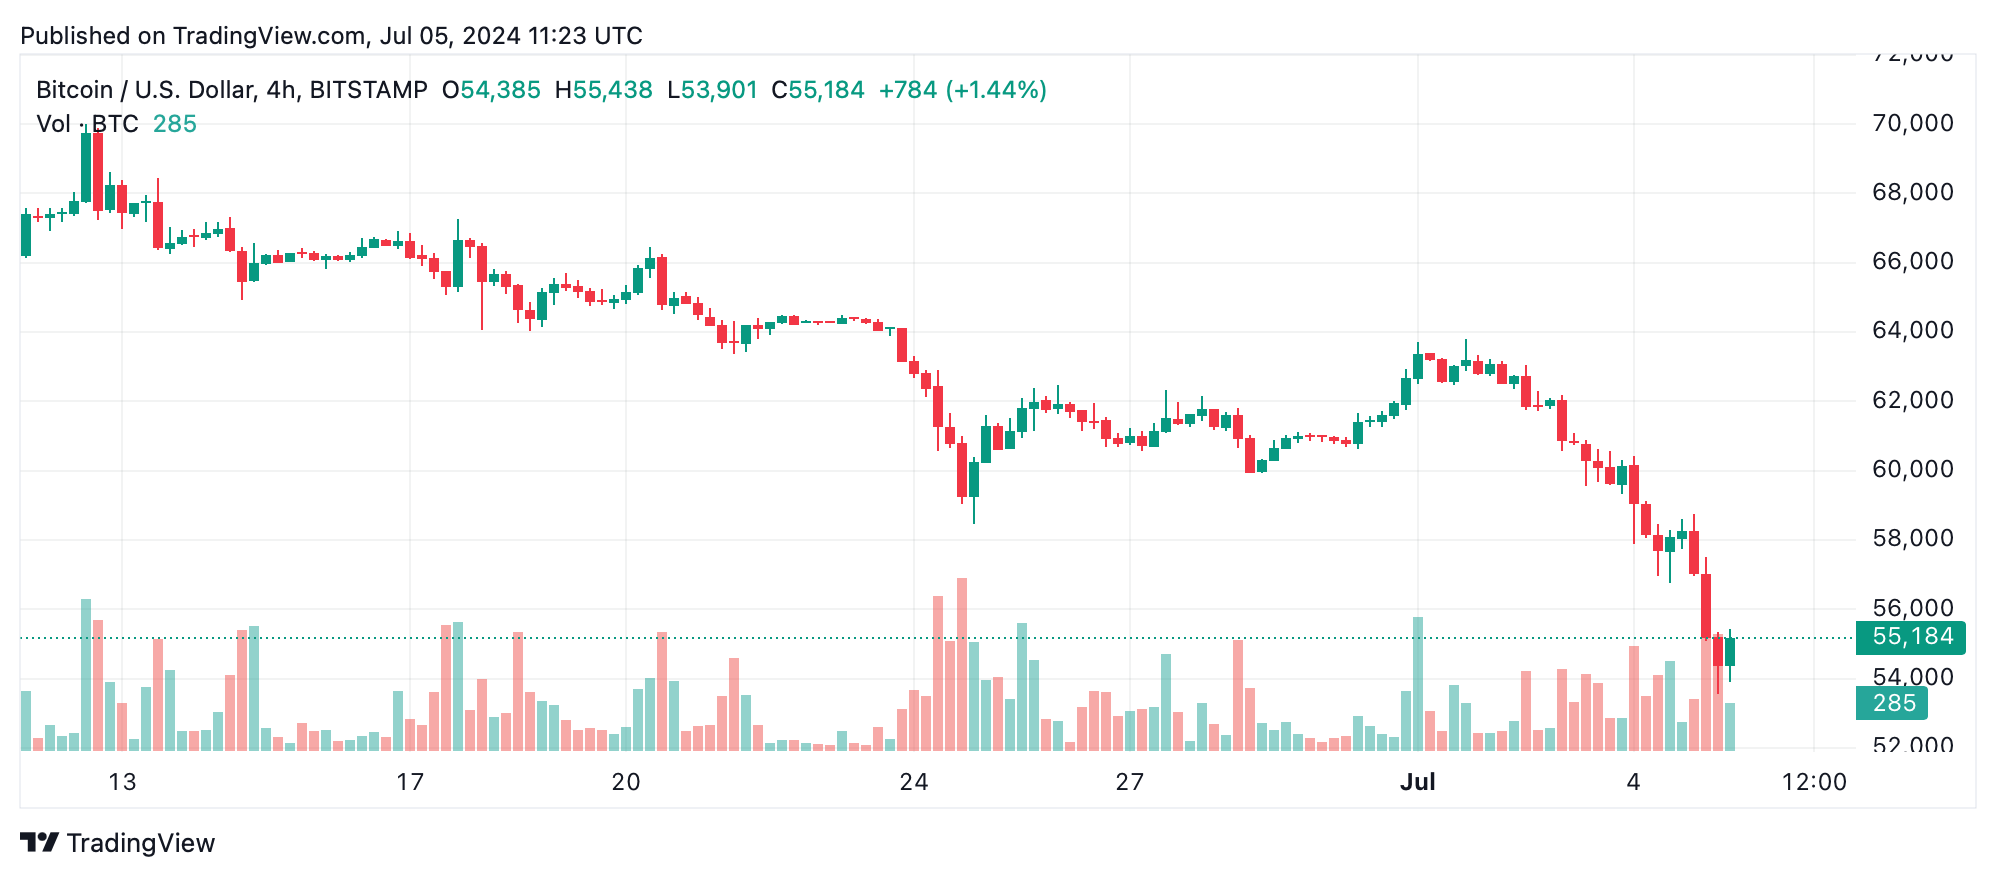
Examining bitcoin’s 4-hour chart, the trend mirrors the hourly chart with a steady decline from $63,794 to $53,550. Volume increased during the price drop, particularly at the lows, indicating accumulation. Support remains firm at $53,550, with resistance pegged at $58,000. Recent indecision among traders points towards potential stabilization and a rebound.
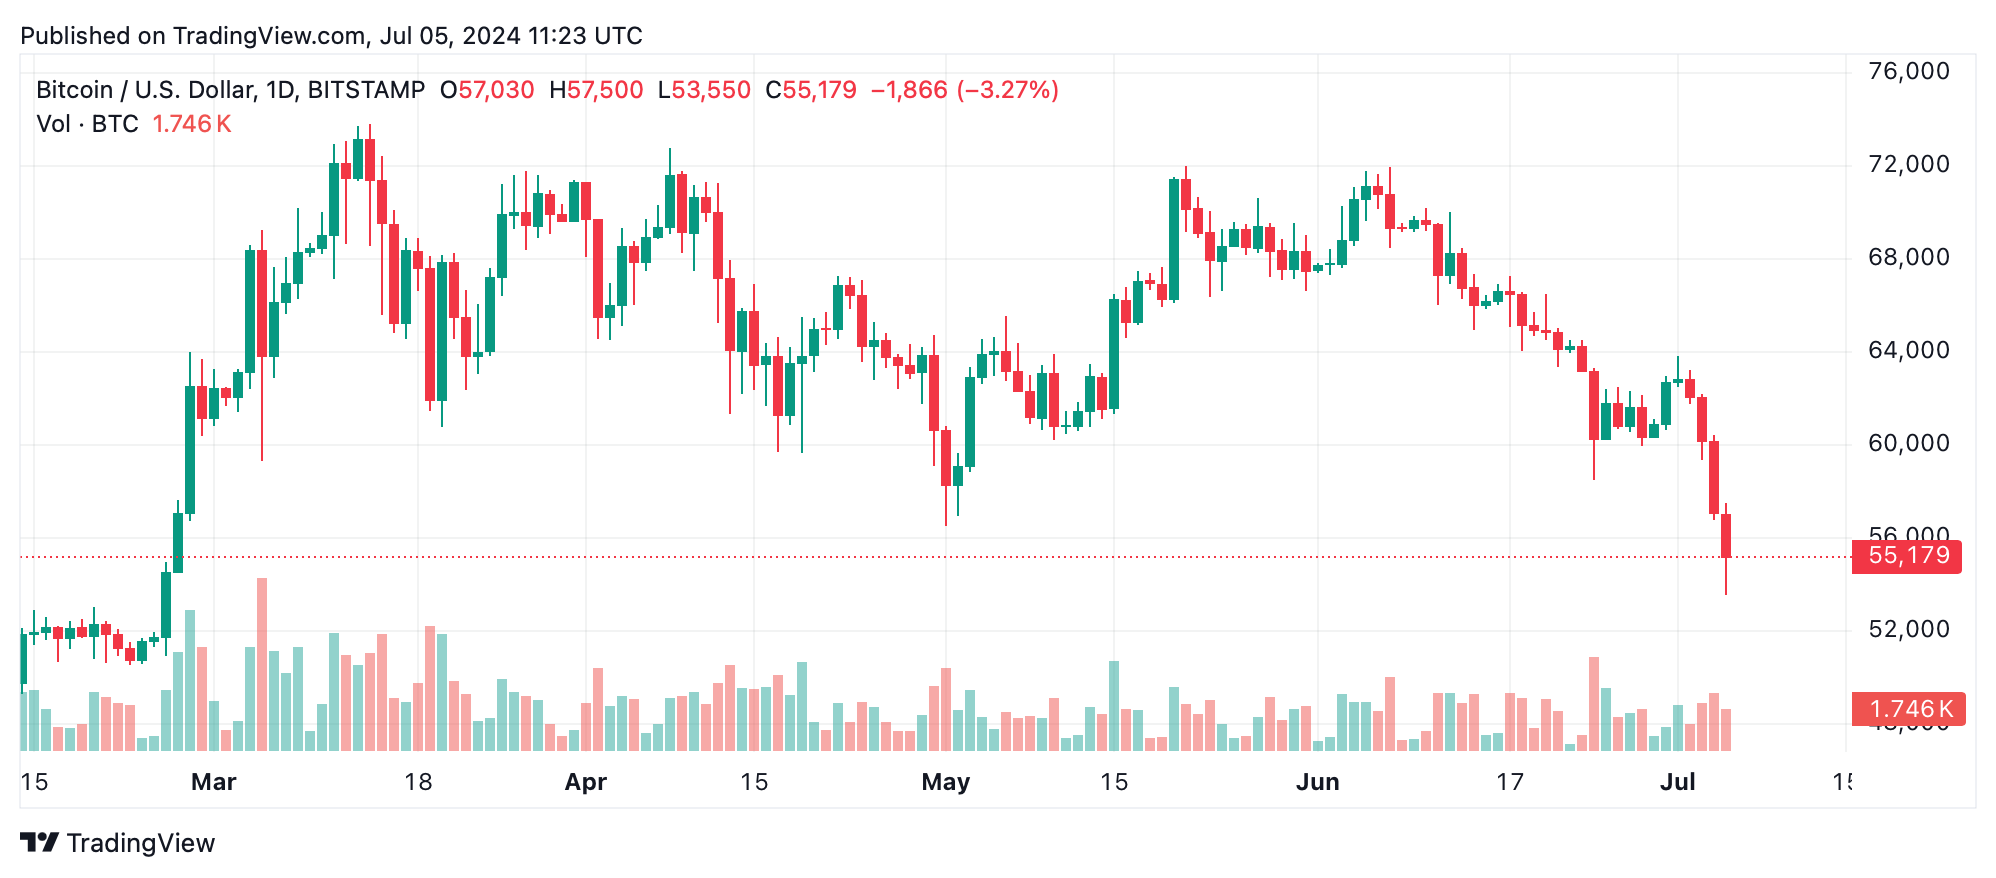
The daily chart shows a prolonged downtrend starting from $72,949, with a sharper decline from the $60,000 zone to $53,550 range. Volume spikes coincide with significant price drops, hinting at possible capitulation and accumulation. The primary support is at $53,550, while resistance is noted around $58,000.
Oscillators are predominantly neutral, with the relative strength index (RSI) at 26, Stochastic at 13, commodity channel index (CCI) at -217, average directional index (ADI) at 36, and the awesome oscillator at -4982. However, the momentum (-6792) and moving average convergence divergence (MACD) level (-2210) reflect the bearish market sentiment.
Moving averages (MAs) across all major periods indicate a sell signal. The 10-period Exponential Moving Averages (EMAs) and Simple Moving Averages (SMAs) are at $59,931 and $60,332 respectively, both indicating a downturn. This bearish indication is consistent across 20, 30, 50, 100, and 200-period moving averages, underscoring the prevailing bearish downtrend in the market.
Bear Verdict:
Bitcoin’s technical indicators reflect a bearish outlook across multiple time frames. While there are signs of potential short-term recovery, the overall sentiment remains negative with key support and resistance levels identified at $53,550 and $58,000 respectively. Traders should exercise caution and consider these technical factors when making trading decisions.
Bull Verdict:
Despite the prevailing bearish outlook, the recent signs of potential short-term recovery and the strong buying interest at lower prices could suggest a bullish opportunity for risk-tolerant investors. Key levels to watch include the support at $53,550 and the resistance at $58,000, as a break above this resistance could signal a trend reversal.