
Bitcoin (BTC) and the leading stock market index, S&P 500, have a historical correlation that has recently been challenged. This divergence hints that either BTC will make a big move upward or the stock market will reverse downwards.
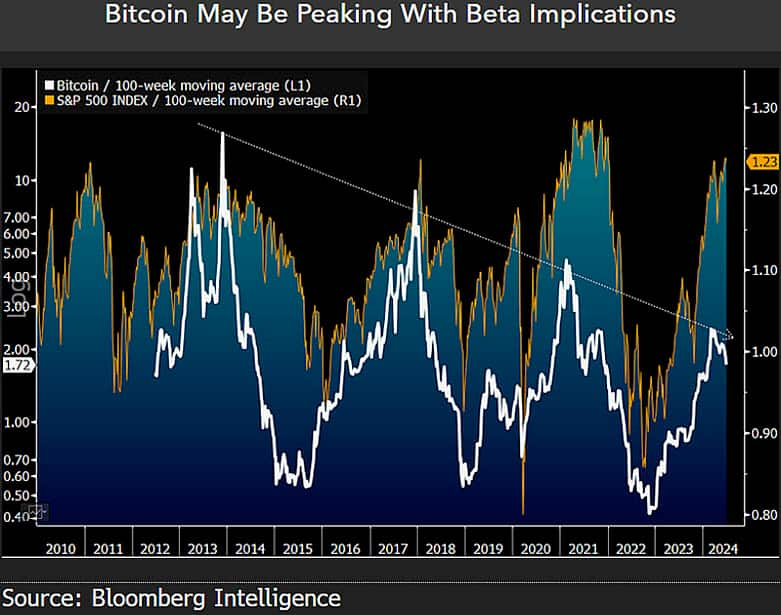
Notably, the Senior Commodity Strategist at Bloomberg Intelligence, Mike McGlone, spotted the divergence between both 100-week moving averages (MA). McGlone shared the discovery in a post on X on July 2, hinting at it being a leading indicator.
According to the strategist, the S&P 500’s MA is already at 23% above its closure in the first half of the year. Conversely, Bitcoin’s moving average is 2.4 times lower than its peak in the first quarter of 2024.
Moreover, the higher time frame chart validates a downtrend in momentum for Bitcoin while also showing the divergence. If the historical correlation is to play out, we should either expect the stock market indicator to fall, or Bitcoin’s indicator to go up. McGlone forecasts a “reversion” for the second half of this year.
Bitcoin’s bearish and bullish contexts
As reported by Finbold, Bitcoin faces a challenging time amid sell-offs by the governments of Germany and the United States. Moreover, Mt. Gox has announced the repayment of over $8 billion in BTC, which has been awaited for over a decade.
In this context, Bitcoin miners started capitulating with record-low reserves and produced hashrate. Meanwhile, old-time supporters like Peter Thiel have lost conviction in the cryptocurrency’s fundamental value proposition.
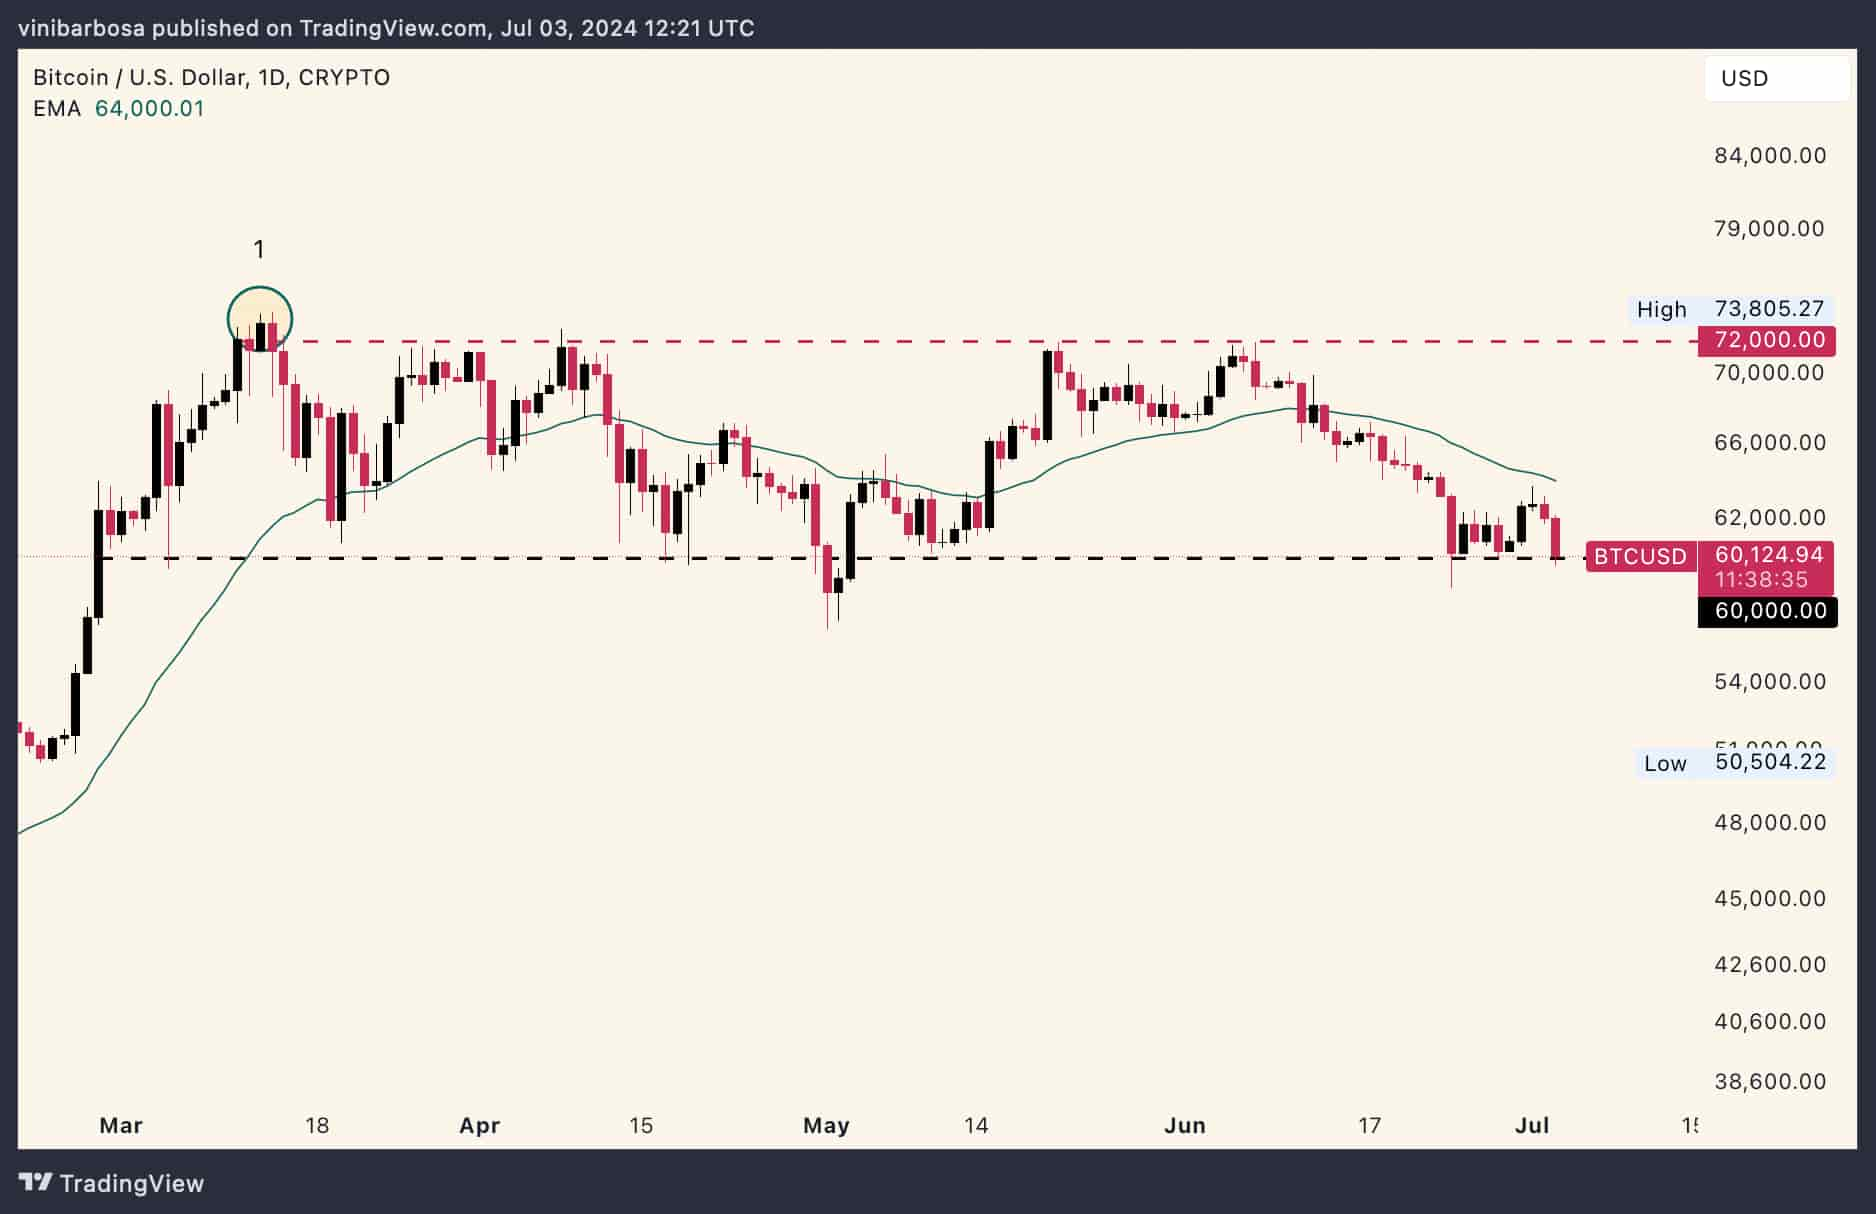
Nevertheless, the BTC price remains within a four-month range, testing support at $60,000, currently trading at $60,100. Crypto traders and investors still foresee a bright future for Bitcoin, with projections ranging from $80,000 to $500,000 despite the fundamental challenges.
BlackRock (NYSE: BLK) and other Bitcoin spot ETF issuers continue to push the maiden cryptocurrency among traditional finance investors, which is expected to generate mid-term demand. Wall Street has recently sold considerable amounts, but the ETFs still display monthly positive capital flows, indicating a bullish bias.
In the meantime, the stock market, measured by the S&P 500, highly benefited from the performance of a small number of premium stocks like Nvidia (NASDAQ: NVDA), which has caused imbalances.
Therefore, investors must closely monitor the finance market and use these indicators to gather investment insights and make their decisions. Caution is needed, considering the uncertain times with forecasted volatility ahead.
Disclaimer: The content on this site should not be considered investment advice. Investing is speculative. When investing, your capital is at risk.