
Although Bitcoin is attempting to mount a recovery, technical indicators suggest that investors should be concerned.
In particular, according to an analysis by investment research platform Game of Trades in an X post on July 2, Bitcoin has broken back into its rising channel around $62,000 after spending four months above it.
Based on this movement, the platform pointed out that Bitcoin’s downside risk is now elevated.
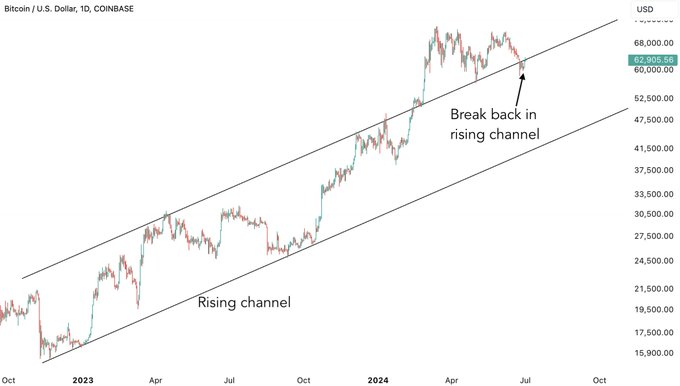
“Bitcoin has now broken back into its rising channel after spending 4 months above it. Until the channel resistance is reclaimed, downside risk is elevated,” the platform noted.
The analysts pointed out that Bitcoin has experienced two consecutive 20% corrections since March of this year, a stark contrast to its behavior throughout 2023 and early 2024. Game of Trades highlighted that this shift in momentum could indicate a significant topping pattern, potentially heralding further declines.
“Our expectation was that Bitcoin was going to make its way back to the channel and then possibly resume its bull market. There was a great setup in May of this year to buy Bitcoin.”
Bitcoin-S&P 500 divergence
Bitcoin appeared poised for a rebound in May, with key moving averages pointing upward and the S&P 500 surging to new all-time highs. Game of Trades noted that it initiated a trade on Bitcoin, which initially saw a positive move. However, Bitcoin failed to break above resistance and began diverging sharply from the S&P 500’s performance.
This breakdown in Bitcoin’s technical posture is concerning for Game of Trades, with the platform raising the possibility of further downside in the short term. The analysis cautioned that this could be a whipsaw or a false breakdown (a bear trap), but the divergence between Bitcoin and the S&P 500 is notable.
“The last two times we saw such a strong divergence between Bitcoin and the stock market were in January 2024 and January 2023. In both instances, Bitcoin eventually caught up to the S&P 500. However, in November 2021, it was the S&P 500 that caught down to Bitcoin.”
Adding to the bearish sentiment, evidence suggests that large Bitcoin holders have been selling over the past few months, a reversal from their behavior at the end of 2022.
Currently, Bitcoin is in a sideways trading range with no clear direction. One possible scenario is for Bitcoin to test the bottom of its price channel before potentially catching up to the S&P 500, which would be a classic bear trap move.
Bitcoin price analysis
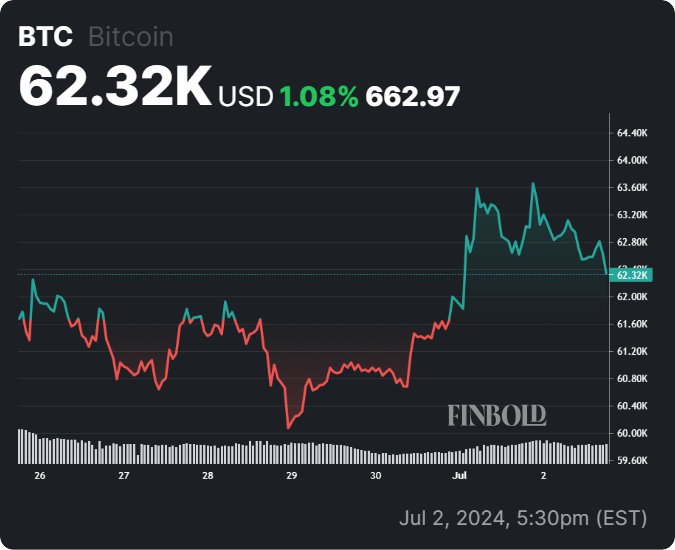
After failing to maintain its price above $63,000, Bitcoin is now attempting to hold its valuation above the $62,000 support. The asset was valued at $62,323 by press time, with daily losses of over 0.6%. On the weekly timeframe, Bitcoin is up over 1%.
The overall trend remains bullish as long as Bitcoin stays within the rising channel. A break below the lower trendline could indicate a potential trend reversal or a deeper correction, while a strong move above the upper trendline could signal further bullish momentum.
Disclaimer: The content on this site should not be considered investment advice. Investing is speculative. When investing, your capital is at risk.