
Bitcoin’s price on July 1, 2024, stands at $62,769, with a 24-hour intraday price range of $61,261 to $63,694. The cryptocurrency’s market capitalization is $1.23 trillion, and the 24-hour trade volume is $21.98 billion.
Bitcoin
Bitcoin’s hourly chart presents a strong upward trend starting from approximately $60,620, peaking at $63,724, followed by a slight decline. The increase in volume during the price surge indicates stronger buying interest. A strategic entry point could be around $62,500 to $63,000 if consolidation and reversal signs appear, with a short-term target near the $64,000 range.
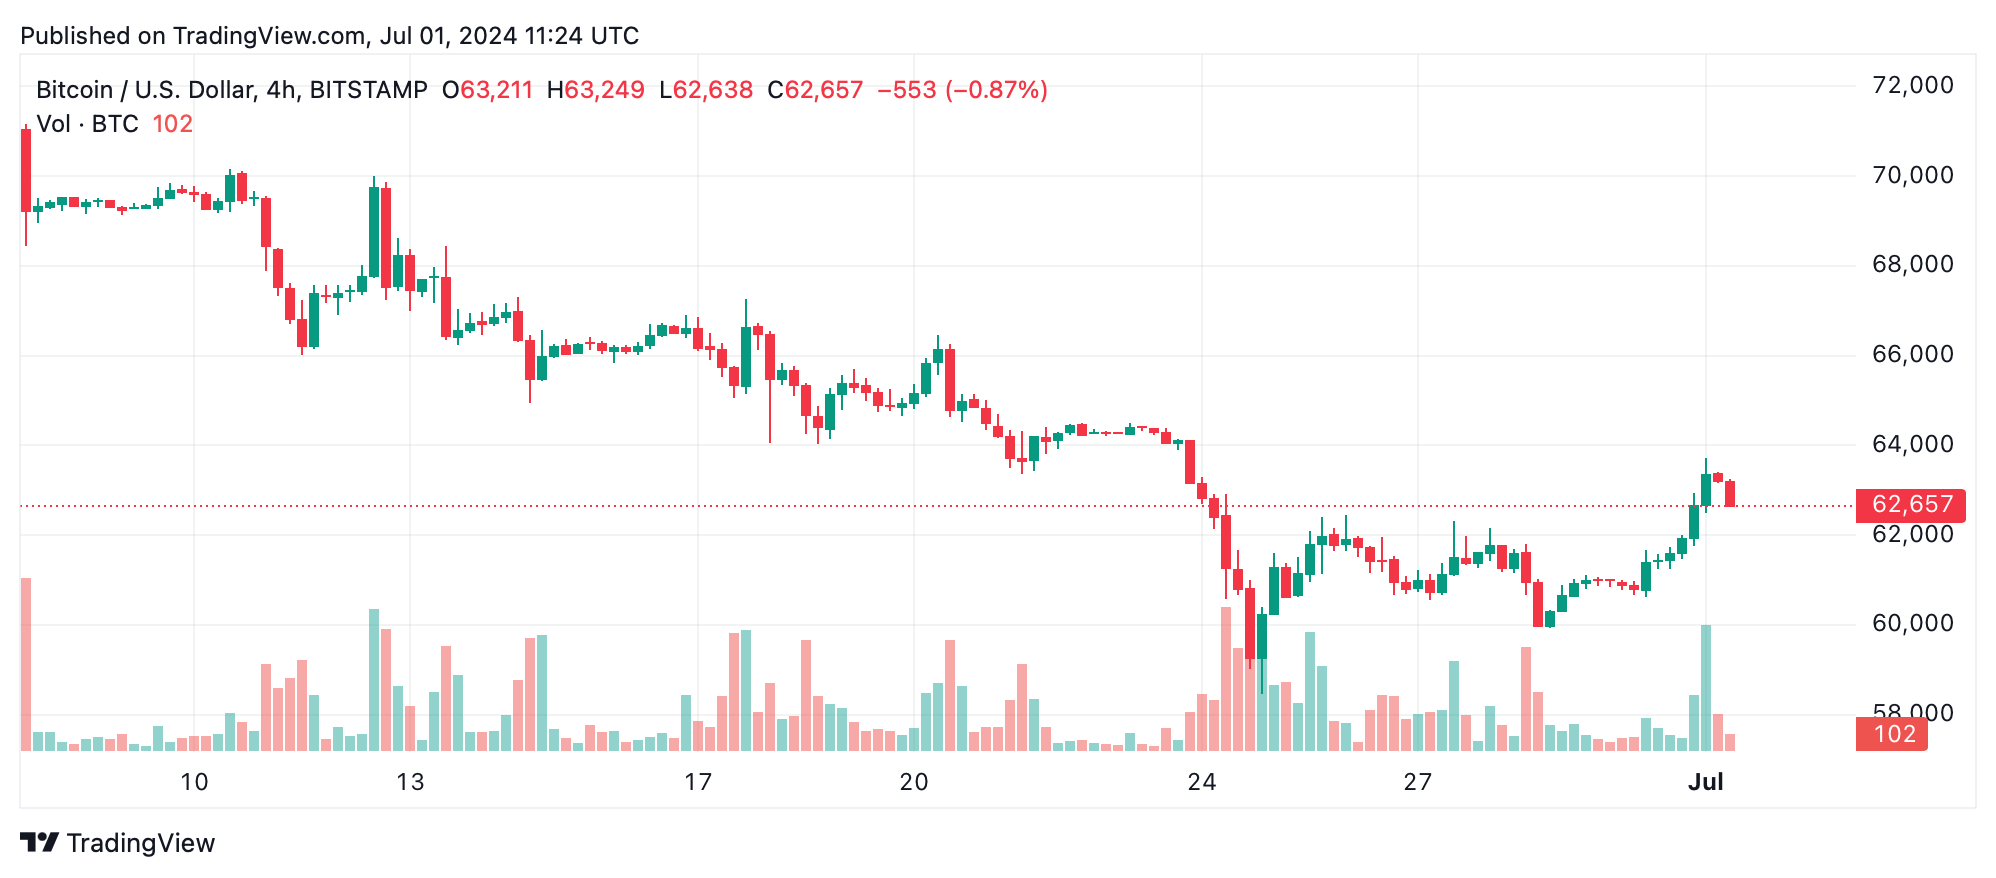
The four-hour chart mirrors the hourly chart, showing a clear uptrend from a low of $59,923 to a peak of $63,724, followed by a minor retracement. The volume pattern supports the price movement with a significant spike during the breakout above $60,000. An entry point around $62,500, aligning with the lower end of the current consolidation zone, is recommended.
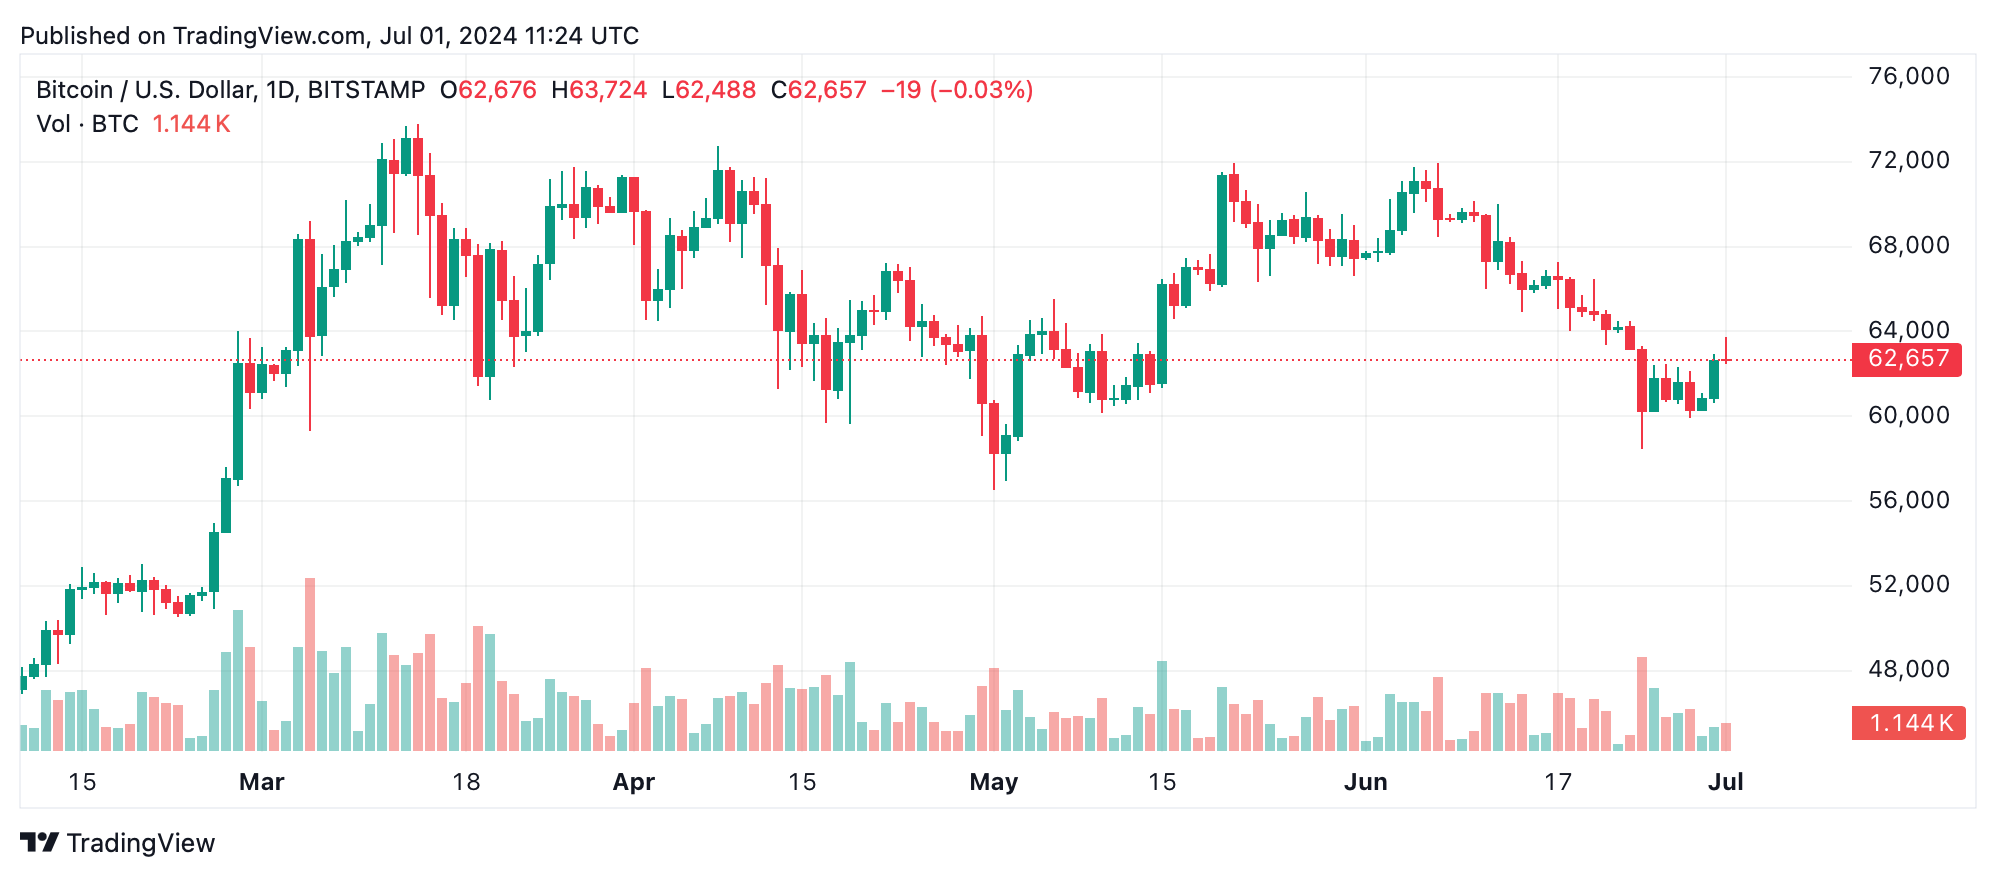
Analyzing the daily chart, we observe a broader picture with a downtrend from a high of $71,949 to a low of $58,456, followed by a recovery to $63,724. Bitcoin volume has remained stable, with noticeable spikes during major price movements. Given the recovery and consolidation, an entry around $62,000 to $63,000 is ideal, especially if the price holds above the $60,000 support level.
The oscillators present a mixed picture. The relative strength index (RSI) at 44 and Stochastic at 43 both indicate a neutral stance. The commodity channel index (CCI) at -32 and the average directional index (ADX) at 33 also suggest a lack of strong directional movement. However, the momentum indicator at -1352 suggests a buying opportunity, while the moving average convergence divergence (MACD) level at -1530 indicates selling pressure. This mixed signal environment calls for cautious optimism, with close attention to further market developments.
Moving averages (MAs) provide additional insights. The 10-period exponential moving average (EMA) and simple moving average (SMA) suggest a buying trend with values at $62,360 and $61,847, respectively. However, the 20, 30, 50, and 100-period EMAs and SMAs are signaling a sell, except for the 200-period EMA and SMA which indicate a buy at $58,195 and $58,212, respectively. This suggests a short-term bullish outlook but potential long-term resistance unless significant support levels are maintained.
Bull Verdict:
Bitcoin’s market outlook for July 1, 2024, is cautiously bullish with key levels to watch around $62,500 for entry and $63,724 for exit. The overall trend suggests potential for upward movement if critical support levels are maintained and buying interest continues.
Bear Verdict:
Despite some bullish signals, bitcoin’s market outlook for July 1, 2024, also presents several sell signals from moving averages and mixed oscillator readings. Traders should remain cautious, watching for potential downward pressure if key support levels fail.