
A trader with a track record for accurate Bitcoin ($BTC) calls says that the crypto king’s bull market trend line is breaking, opening the door for a correction.
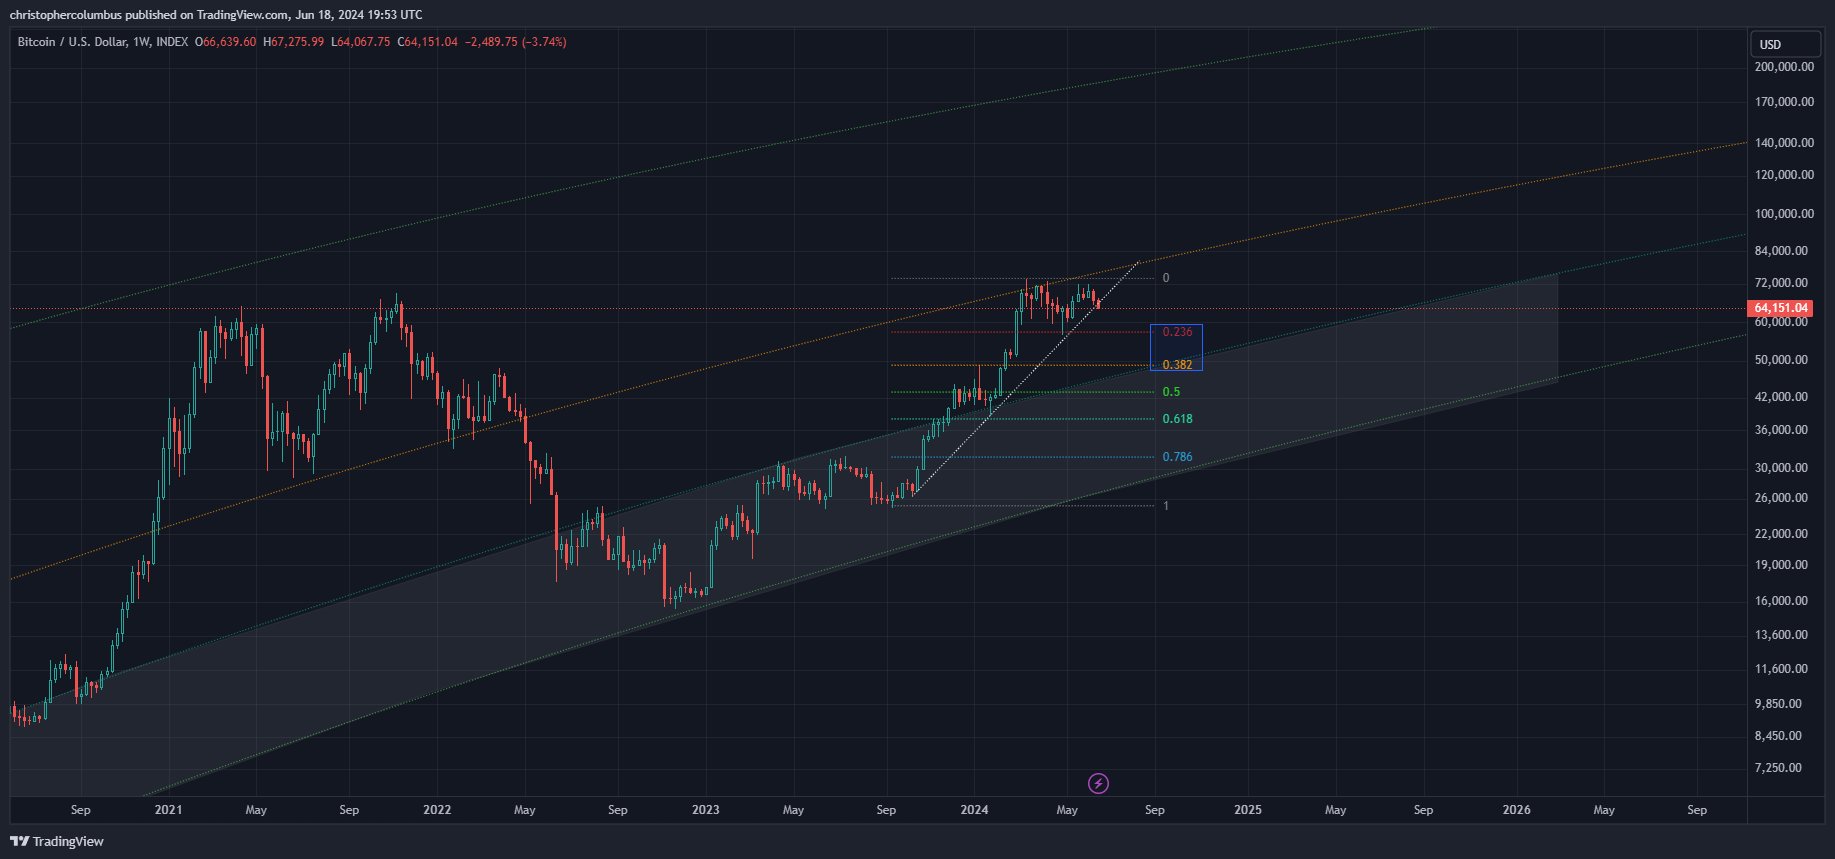
Pseudonymous analyst Dave the Wave tells his 146,000 followers on the social media platform X that $BTC may soon make a move to the downside, possibly dropping to as low as the 0.38 Fibonacci level which is around the $50,000 mark.
“With the trendline breaking, a weighted outlook has to shift toward further consolidation of $BTC price over the shorter term. Looking either for a range to form [0.23 fib] or support at the buy zone [0.38 fib]. This may well set up for a better 4th quarter.”
The trader says he’s watching the monthly chart for more confirmation of a trend reversal.
“Still wanting to see some follow-through on the monthly to confirm a change of trend… these things take time.”
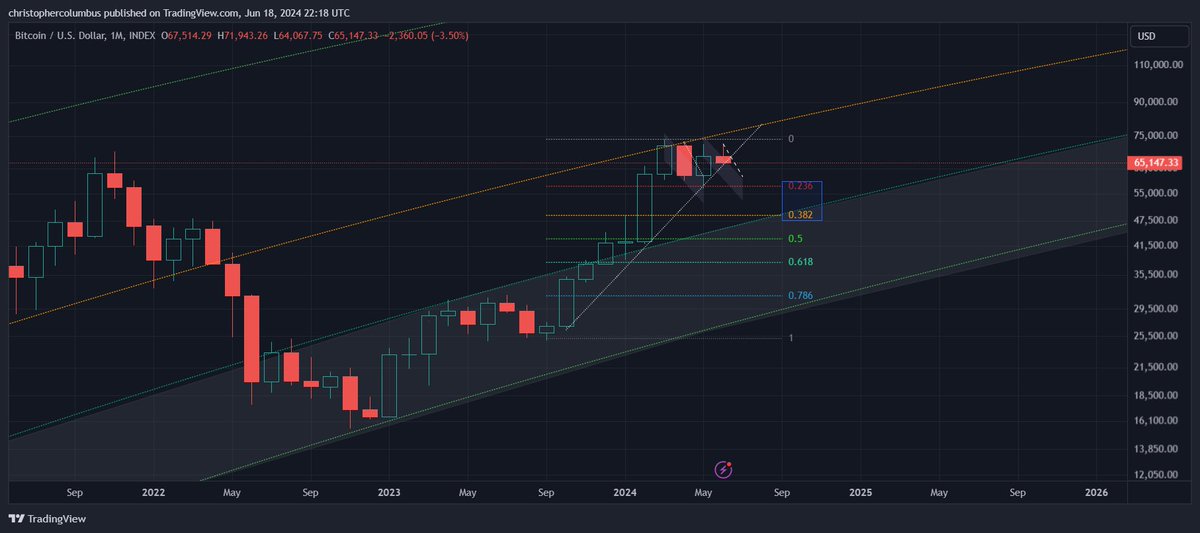
Bitcoin’s current monthly candle has gone slightly lower since Dave the Wave posted his chart, now trading below the diagonal support level.
The analyst recently predicted a market top for Bitcoin in December 2025 by using his version of the logarithmic growth channel (LGC) curve, which aims to predict Bitcoin’s longer-term cycle lows and highs while filtering out shorter-term volatility.
“If you subscribe to the $BTC four-year cycle theory, then it may not help you much with the top (again). However, if you subscribe to the LGC theory, it may once again be useful.”
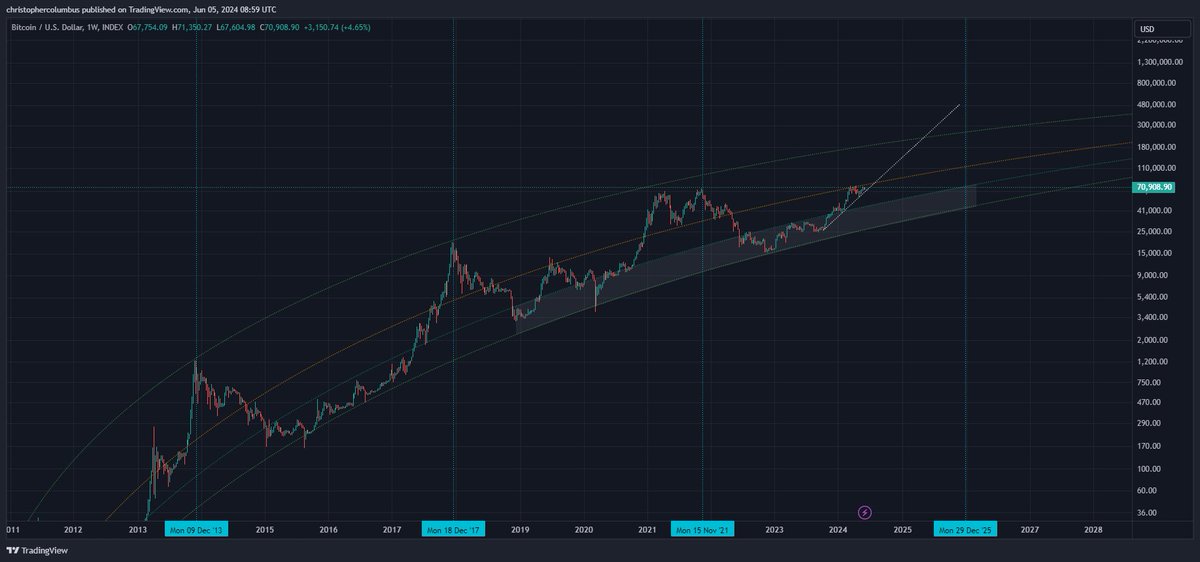
Looking at his chart, the analyst suggests Bitcoin could hit the top of the LGC model and soar above $300,000 at the end of 2025.
At time of writing, Bitcoin is trading at $62,249, down over 3% on the day.
Generated Image: Midjourney