
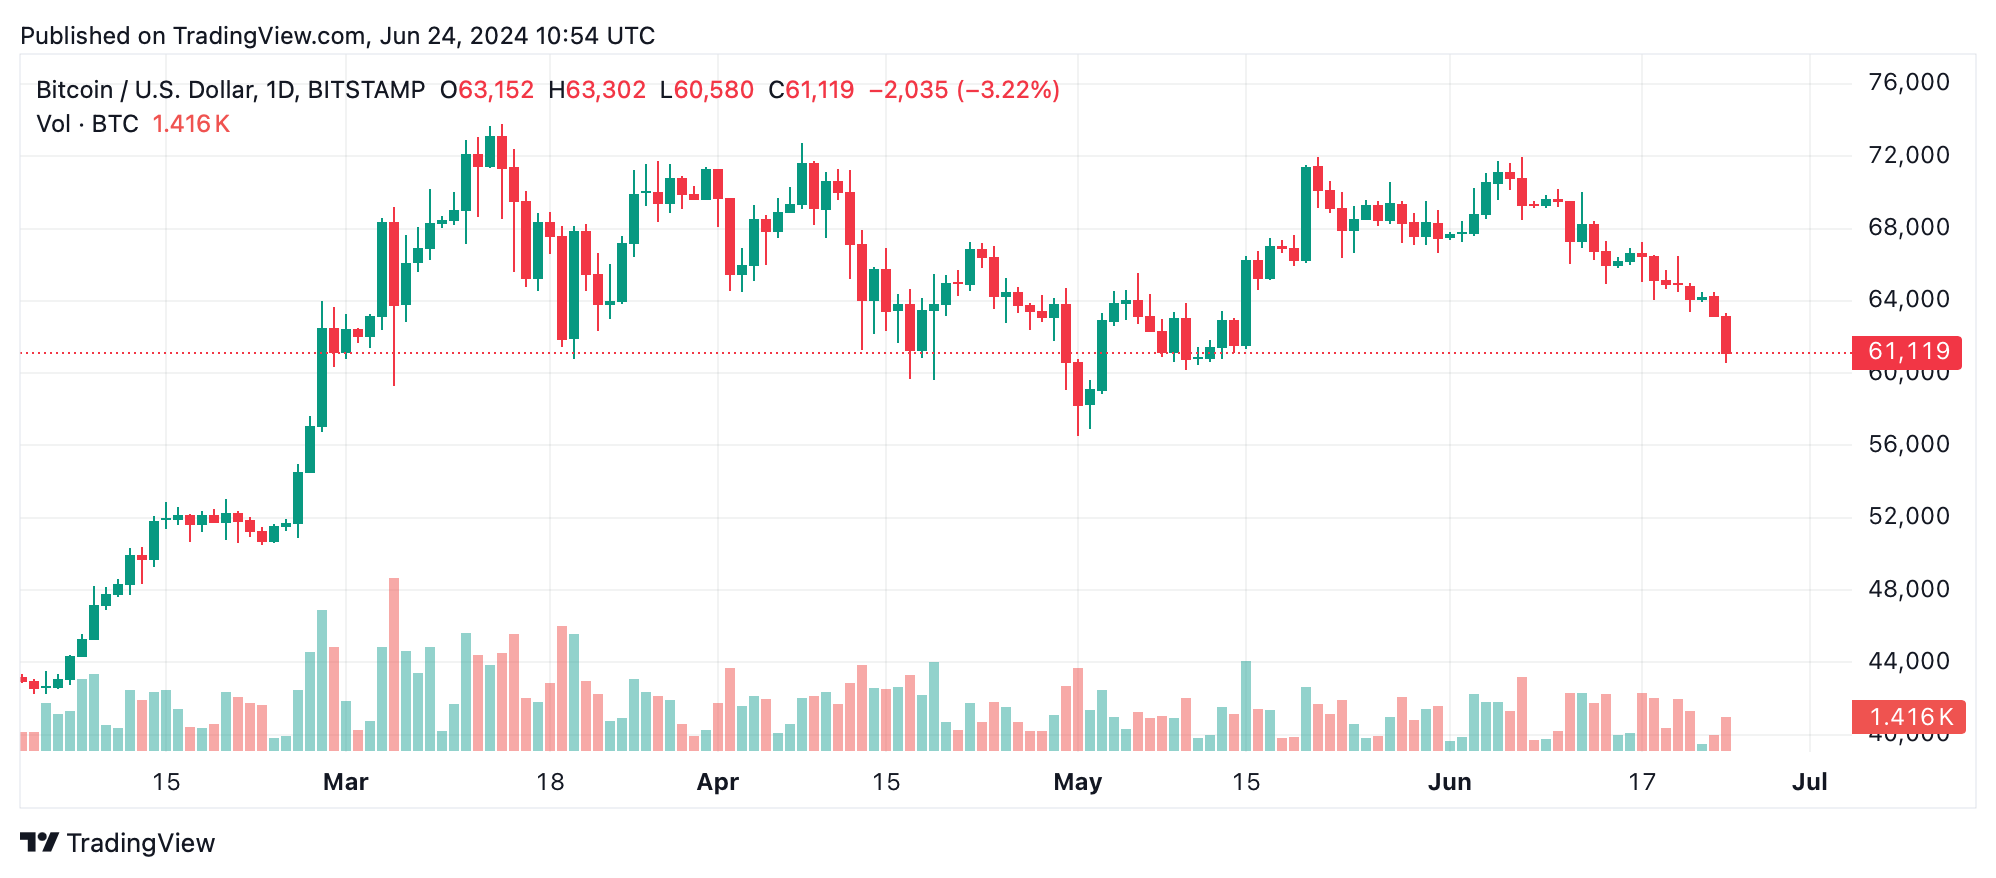
Bitcoin’s price action on June 24, 2024, indicates a clear bearish trend. Hovering around $61,171, bitcoin has fluctuated between $60,580 and $64,384 in the past 24 hours. $BTC’s market cap is $1.21 trillion, with a trading volume of $19.12 billion, reflecting significant market activity despite the decline. The decline on Monday aligned with recent news from Mt Gox, where the trustee announced that bitcoin payments to creditors will commence in July.
Bitcoin
Bitcoin’s 1-hour chart reveals a sharp decline from approximately $64,490 to the intraday low of $60,580. This movement was accompanied by a significant spike in volume, highlighting strong selling pressure. Key support levels were breached, suggesting potential for further downside unless a reversal pattern emerges. Traders are advised to look for stabilization or consistent upswings with increasing volume before considering entry points.
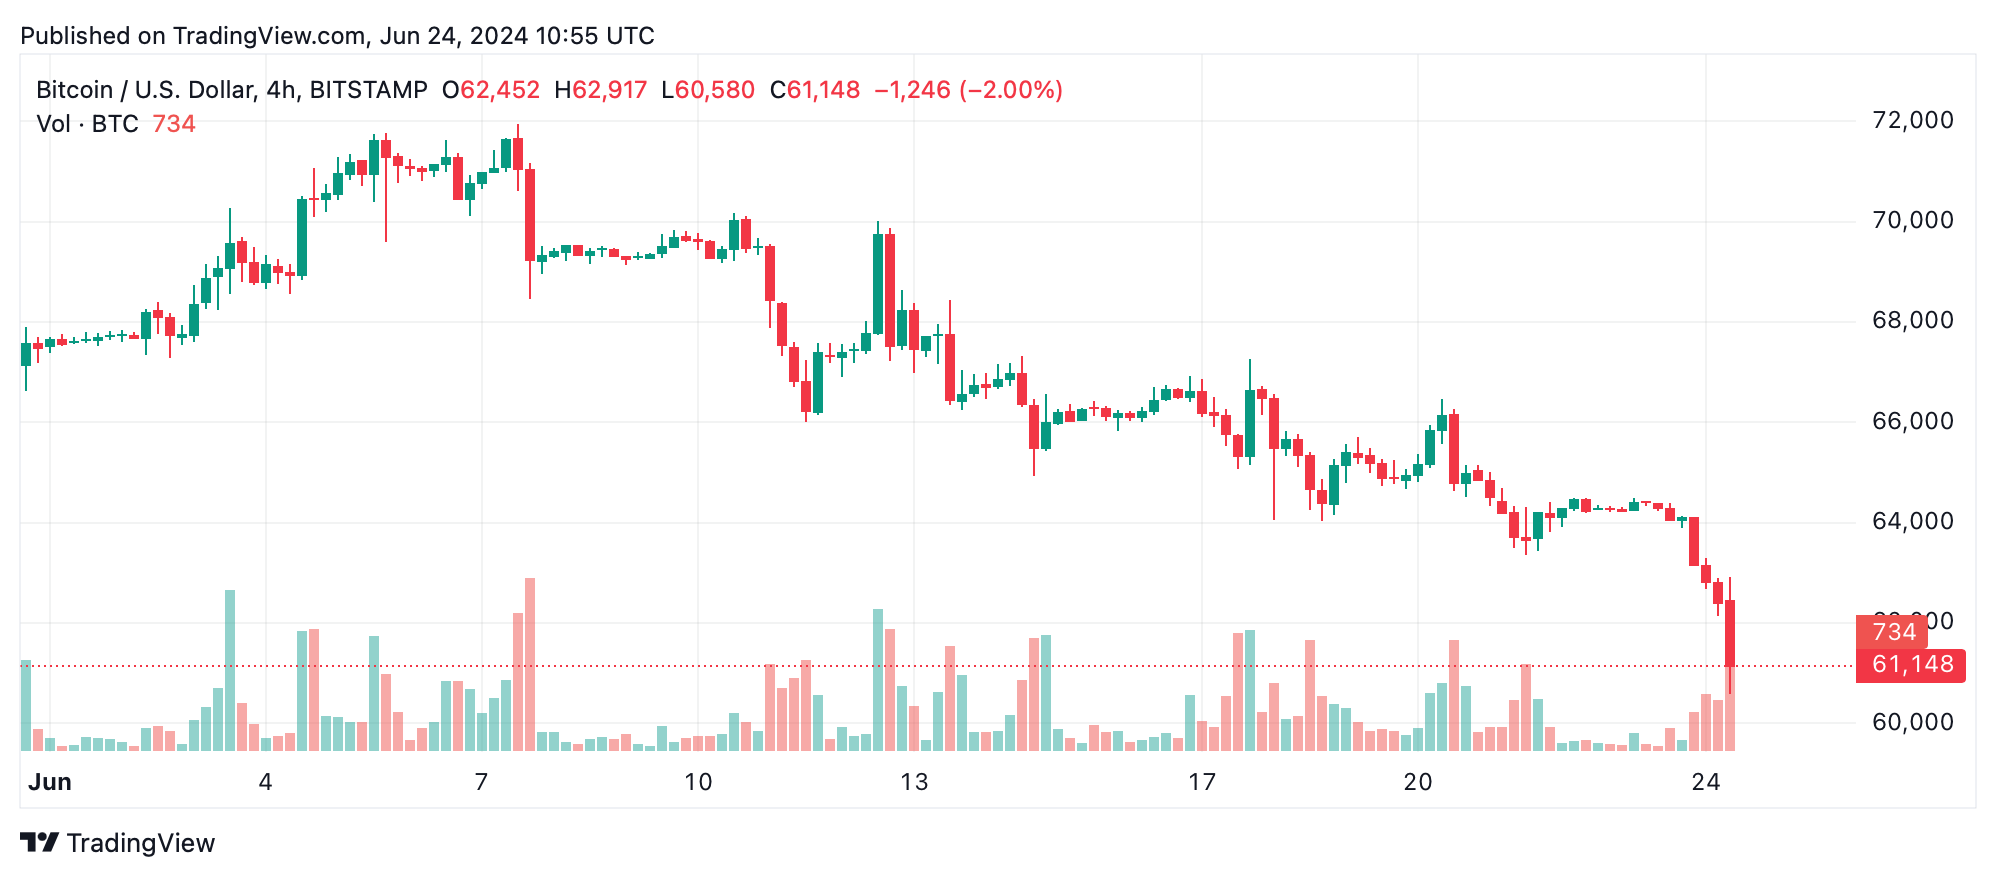
On the 4-hour chart, bitcoin’s price continued its downward trajectory from about $66,455 to $60,580. The increased volume during this decline supports the notion of a more substantial bearish movement. Entry points should be considered only upon confirmation of a reversal pattern or strong support around $60,000. Exit strategies should have been enacted at earlier support breaches, such as $64,000 and $62,500 per unit, to minimize losses.
The $BTC/USD daily chart on Bitstamp reflects a prolonged downtrend from a high of $71,949. The sustained high selling volume on recent downturns underscores a bearish sentiment. Long-term holders should monitor critical support levels around $60,000, with potential exits if these levels fail, indicating further downside risk.
Oscillators present a mixed picture, with most indicators in a neutral position. The relative strength index (RSI) at 28, Stochastic at 7, and commodity channel index (CCI) at -161 all suggest a neutral stance, while the momentum indicator at -4733 and moving average convergence divergence (MACD) level at -1247 signal bearish sentiment. This suggests caution, as momentum indicators point towards continuing negative momentum.
Moving averages (MAs) further support bitcoin’s bearish outlook. Short to medium-term exponential moving averages (EMAs) and simple moving averages (SMAs) (10, 20, 30, 50, 100 periods) all indicate a bearish action, with values ranging from $64,423 to $67,311. However, the 200-period EMAs and SMAs present a bullish signal at $57,961 and $57,564, respectively, indicating long-term support might still hold.
Bull Verdict:
Despite the current bearish trend, the 200-period moving averages suggest long-term support remains intact. If bitcoin can find strong support around the $60,000 level and exhibit signs of reversal, there may be potential for a bullish recovery.
Bear Verdict:
The prevailing indicators point to a sustained bearish trend. The majority of short to medium-term moving averages and momentum indicators signal continued downside. Traders should be cautious and consider exiting positions upon breaches of critical support levels to manage risk effectively.