
As Bitcoin (BTC) navigates a bearish environment, technical analysis has identified chart formations that could signal upside potential.
In an analysis posted on TradingView on June 21 by crypto trading expert TradingShot, Bitcoin’s one-week time frame chart reveals a giant cup and handle (C&H) pattern, which began forming at the peak of the previous bull cycle.
It’s worth noting that the cup and handle pattern, a bullish continuation signal, indicates potential price increases. However, according to the analyst, it is often overlooked by traders focused on short-term movements. Bitcoin’s chart shows it in the handle phase, forming a channel down.
The expert noted that a review of the pattern focuses on the critical factor of which moving average (MA) period will provide support: the 1-day MA200 (1D MA200) or the 1-week MA50 (1W MA50). Notably, the 1D MA200 provided early support during the current bull cycle and served as a strong rebound point during the week of March 6, 2023.
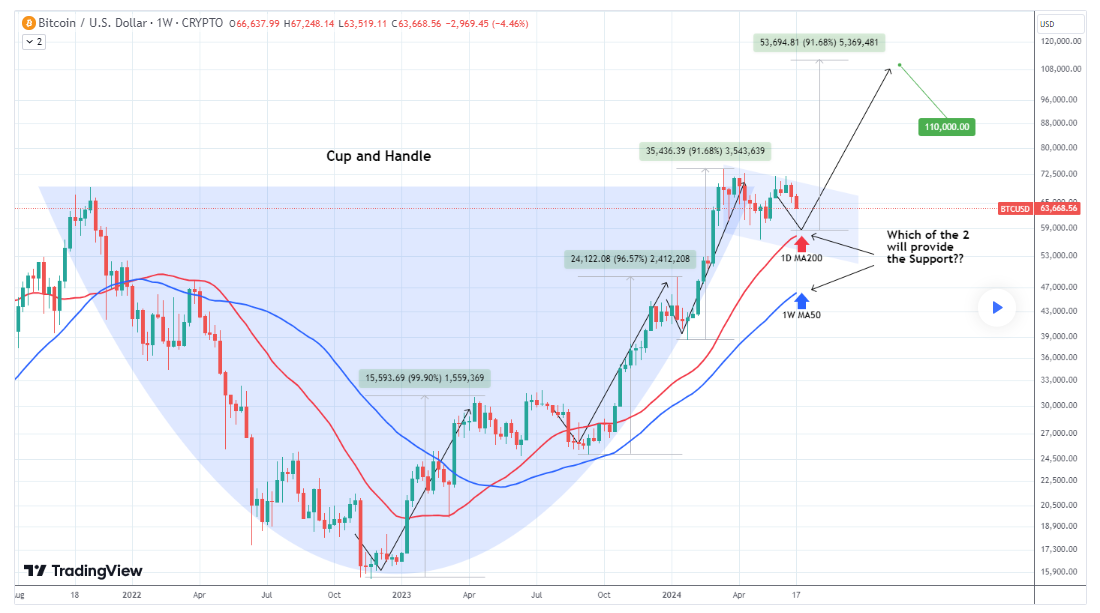
On the other hand, the 1W MA50 has been a reliable support level since the breakout on March 13, 2023, coming close to the price action around the week of September 11, 2023.
Notably, the cup formed from early 2022 to mid-2023, followed by the handle forming through a downward channel into 2024.
Bitcoin’s next target
A crucial aspect of this analysis is the expected percentage rise after the handle is complete. Since the bottom of the bear cycle in November 2022, Bitcoin has experienced three expansion legs ranging from +91% to +99%. Each successive leg has been slightly shorter, decreasing by approximately 4% to 5%.
Assuming the 1D MA200 holds as the support and the handle completes at this level, the analyst noted that the next expansion leg could propel Bitcoin to the $100,000 – $110,000 target zone. This represents a potential upside of around 70% from the current levels.
“As a result, assuming the 1D MA200 holds and the Handle is completed there, we can expect the next Expansion Leg to reach the $100k – $110k Target Zone,” the expert noted.
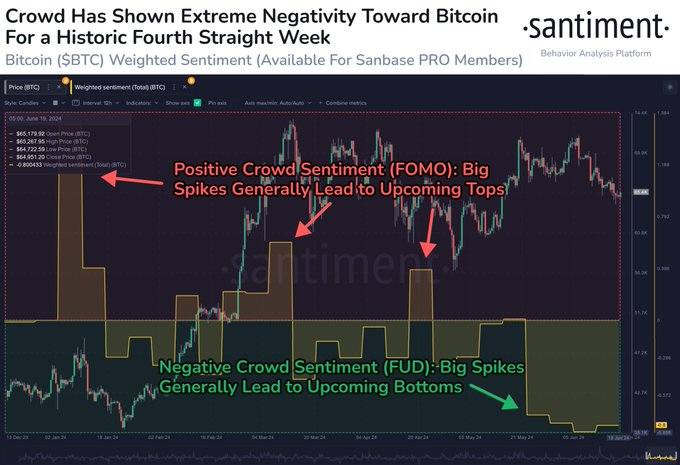
Amid the bullish price projection, Bitcoin still has a long way to go to shake out the short-term bearish conditions. Notably, the maiden cryptocurrency increasingly faces the threat of resetting the $60,000 support. At the moment, the asset is faced with fear, uncertainty, and doubt (FUD) amid continued sideways trading.
Particularly, on-chain analysis platform Santiment indicated that Bitcoin has suffered an “extended level of FUD” on social media platform X. Data shared on June 20 suggested that investors are likely fearful or disinterested.
At the same time, Bitcoin is weighed down by ongoing outflows in the US spot exchange-traded funds (ETF). Notably, June 20 marked the fifth straight day of net outflows from the ETFs, which hit $900 million.
Bitcoin price analysis
By the time of reporting, Bitcoin was trading at $63,940, having plunged over 2% in the last 24 hours. On the weekly timeframe, Bitcoin is down 4.3%.
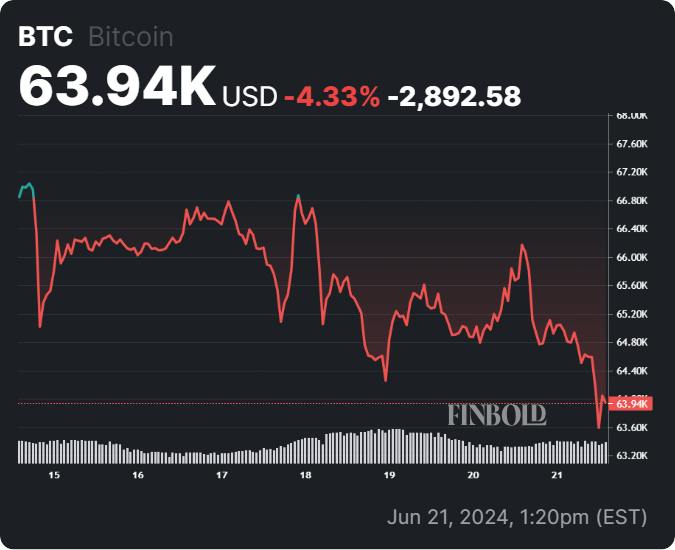
Over the past week, Bitcoin has shown a general decline in price with notable volatility, struggling to maintain higher levels, encountering resistance around $65,000 and support around $63,000.
Disclaimer: The content on this site should not be considered investment advice. Investing is speculative. When investing, your capital is at risk.