
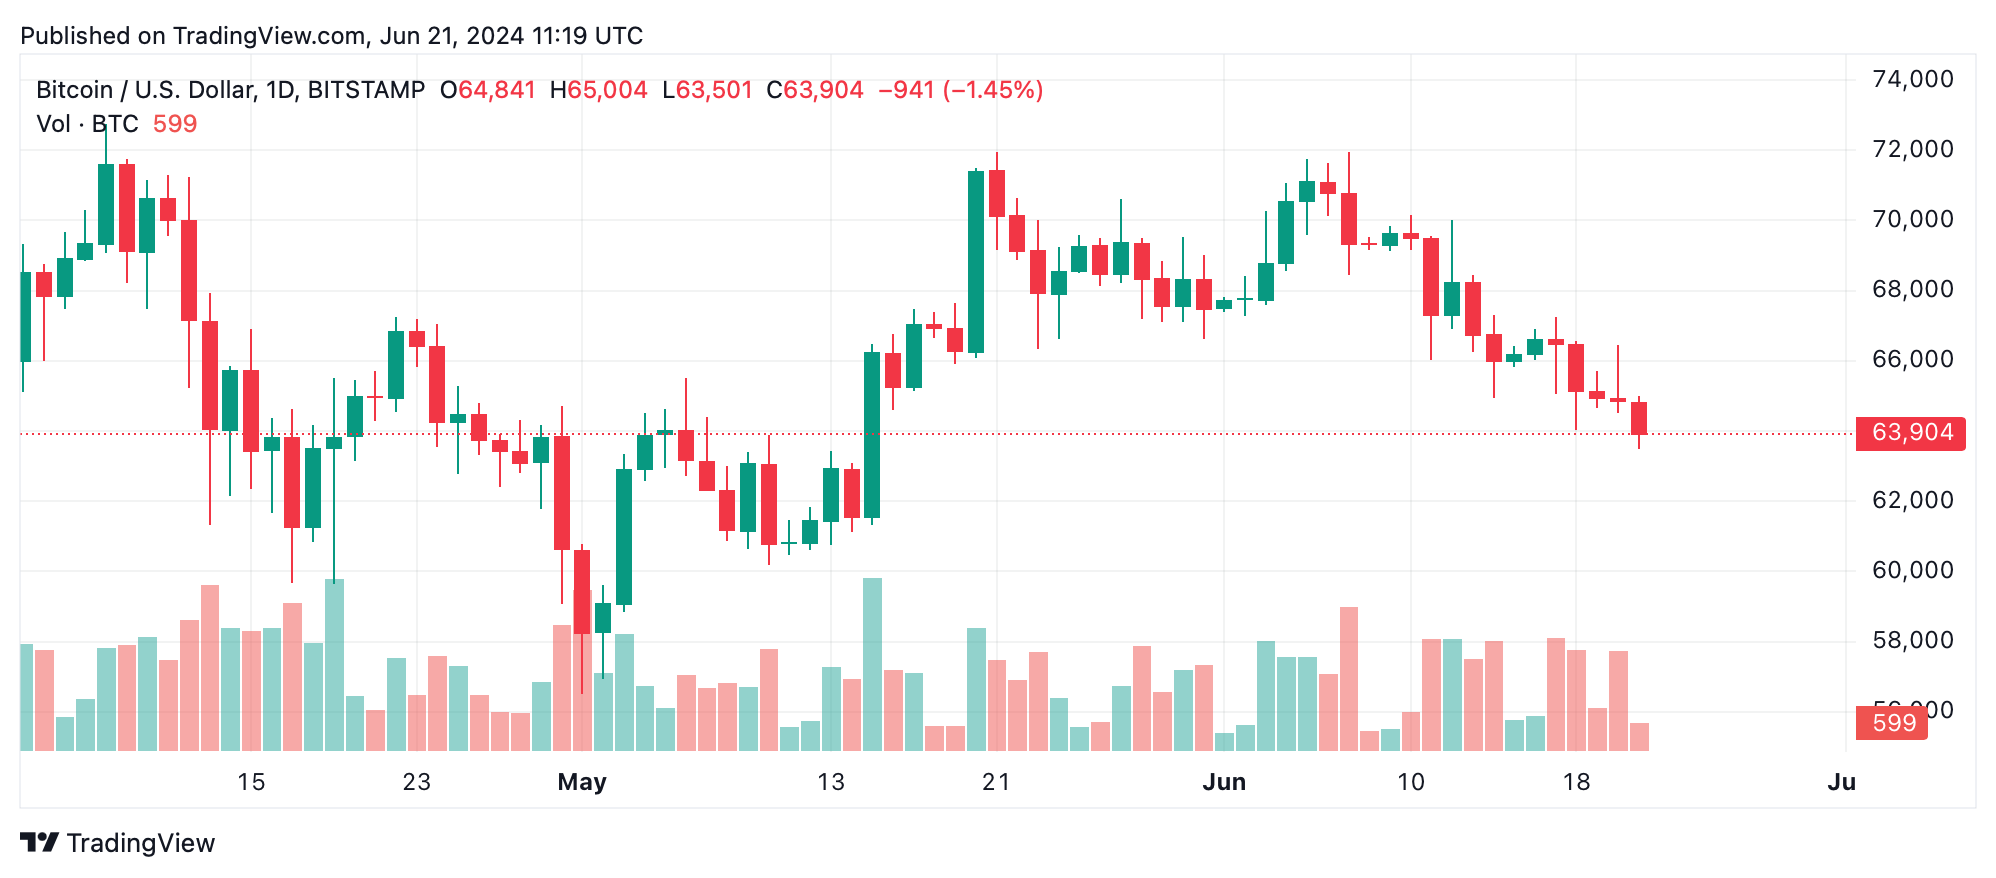
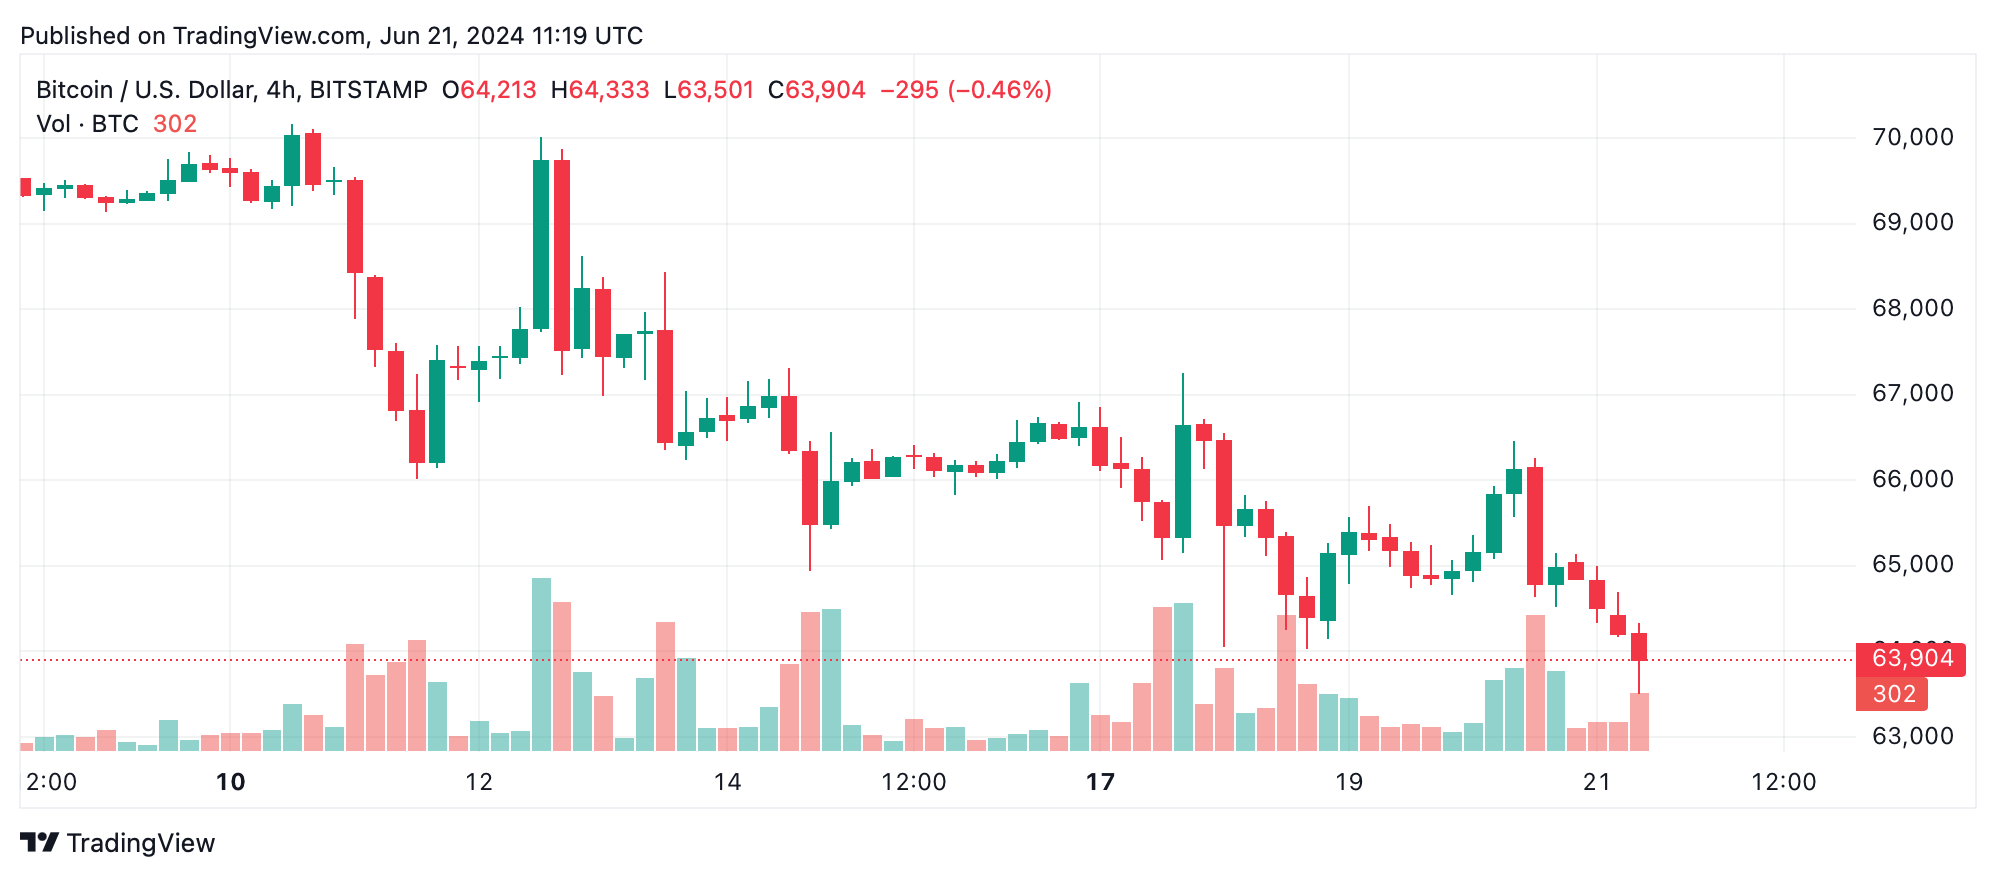
Bitcoin’s price continues its downward trajectory, coasting along at $63,950 per unit on June 21, 2024. Despite showing potential entry points, the market is experiencing significant selling pressure across all time frames. Technical indicators suggest a cautious approach for traders as bearish trends dominate the charts.
Bitcoin
In the short term, the 1-hour chart indicates a persistent downtrend with bitcoin recording consistent lower highs and lows, recently touching $63,501. Trading volume remains low, reflecting weak momentum. Traders may consider entering around $63,000 to $63,500 if a reversal with increased volume is observed, targeting an exit near the resistance level of $67,000 or higher.
The 4-hour chart also shows a significant downtrend, with bitcoin’s price dropping sharply from $67,260 to $63,501. Heavy selling pressure is evident from noticeable spikes in red volume bars. An entry point around the $63,000 support level is advisable if there’s a bullish reversal, ideally confirmed by increased buying volume. Exit strategies should aim for the previous resistance level of $67,260 to secure potential gains.
Analyzing the daily chart, bitcoin has moved from a high of $71,958 on May 20 to today’s low of $63,501, maintaining a clear downtrend. Consistent selling pressure is evident. Long-term traders might find an entry point if the price stabilizes at $63,000 and exhibits a strong reversal pattern, such as a bullish engulfing candle with higher volume. An exit near the $67,000 to $68,000 levels is suggested, where historical price action indicated resistance.
Oscillators paint a neutral picture overall, with the relative strength index (RSI) at 36, Stochastic at 9, commodity channel index (CCI) at -134, and the awesome oscillator at -2808. Momentum indicators offer mixed signals; the momentum suggests a bullish signal, while the moving average convergence divergence (MACD) level indicates a bearish action. These conflicting signals highlight the need for caution and careful analysis before making trading decisions.
Moving averages (MAs) predominantly signal bearish sentiment across various time frames. The exponential moving averages (EMAs) and simple moving averages (SMAs) for 10, 20, 30, 50, and 100 periods are all aligned with negative signals. However, the 200-period EMA and SMA are bullish, indicating potential support and a possible reversal at longer time frames. Traders should watch these levels closely to gauge the market’s next moves.
Bull Verdict:
Despite the prevailing downtrend, bitcoin shows potential for a bullish reversal if the price stabilizes around the $63,500 level. Key indicators such as the 200-period EMA and SMA signaling positive sentiment suggest that long-term support may hold, presenting an opportunity for gains if reversal patterns emerge and are confirmed by higher trading volumes.
Bear Verdict:
The bearish trend is dominant across all analyzed time frames, with consistently lower highs and significant selling pressure. Oscillators and MAs predominantly indicate bearish signals, pointing to continued downside risk. Without a clear reversal pattern and increased volume to support a bullish case, caution is warranted as bitcoin’s price could face further declines.