Bitcoin (BTC) bears are at it again, driving the price down nearly another 10% on March 8 during the weekend when volume is at its thinnest.
So is the pre-halving rally over already? Or is it just about to get started?
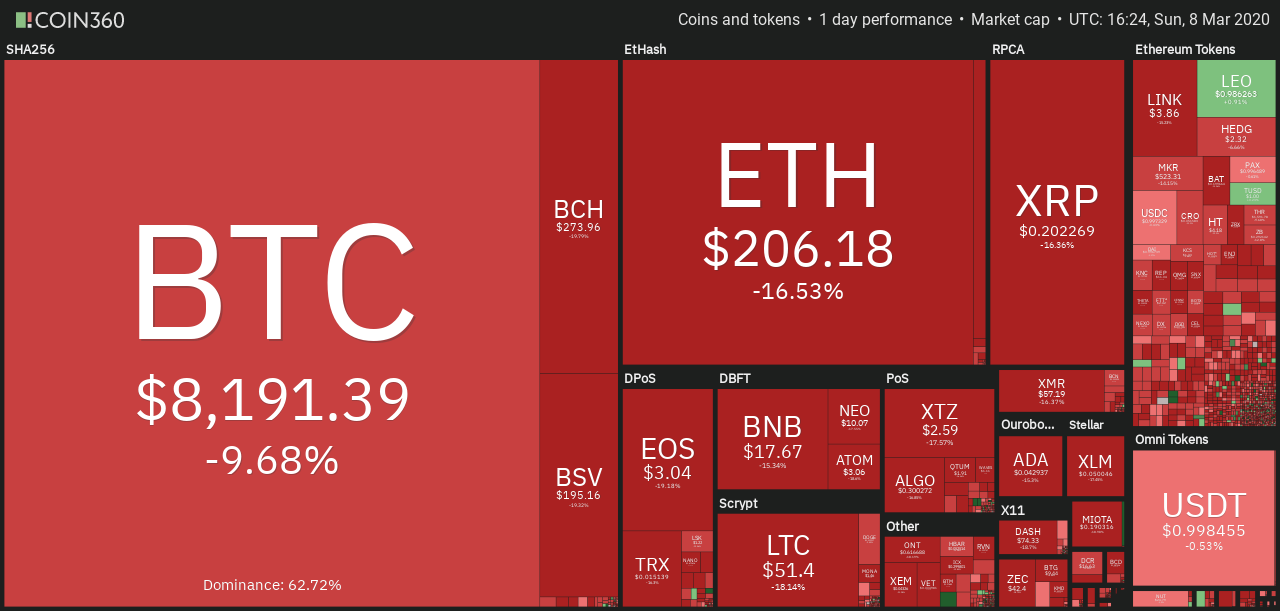
Daily crypto market performance. Source: Coin360.com
The 4-hour outlook
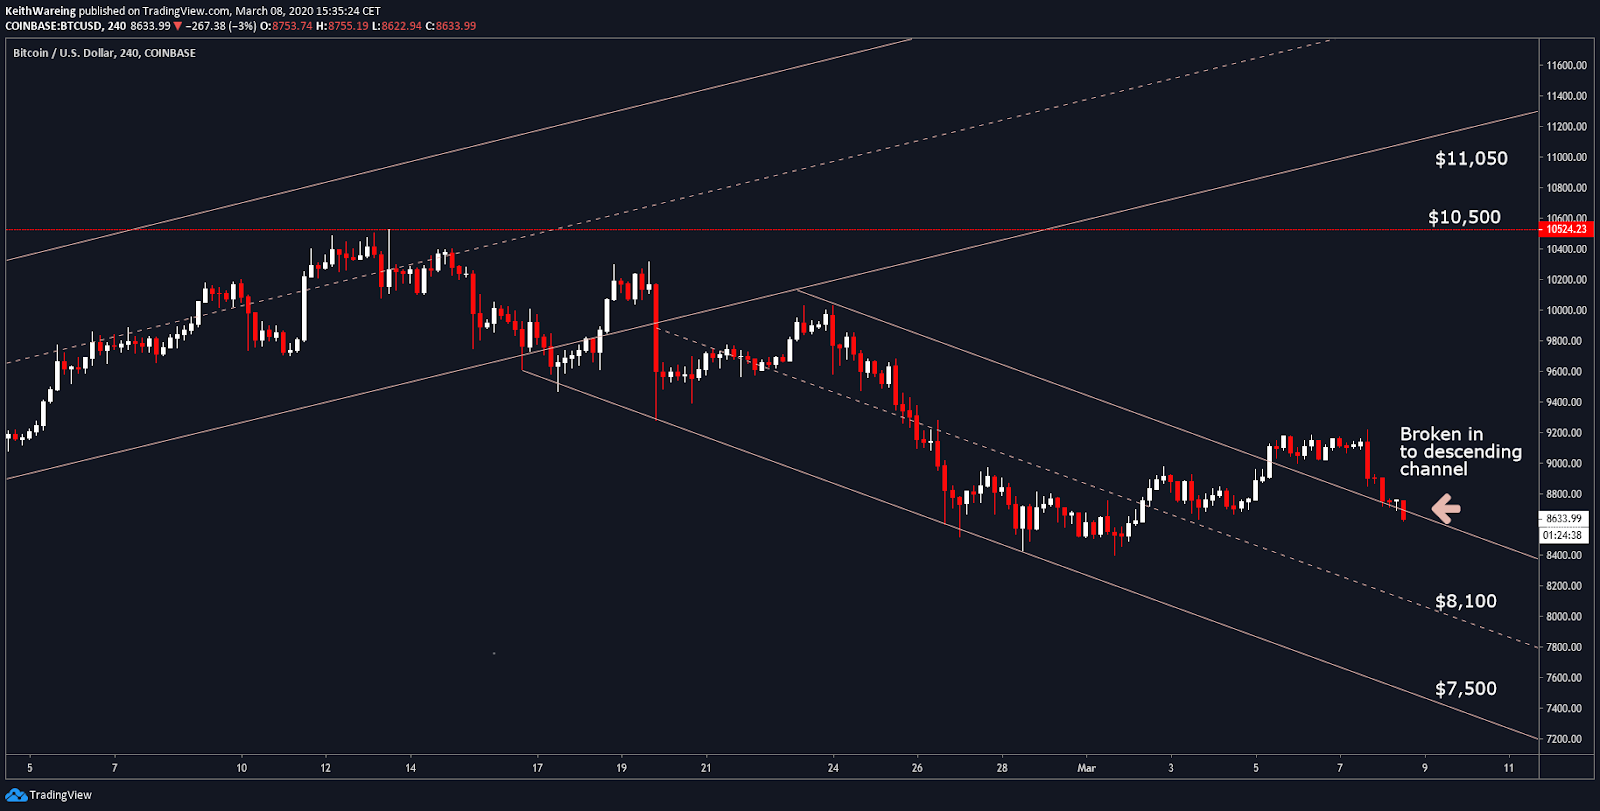
BTC USD 4-hour chart. Source: TradingView
Bitcoin broke out of a worrying descending channel on March 5. However in the last hour, after retesting the support line of this channel several times, it has now broken back into it just three days later.
This gives Bitcoin two very real downside targets of $8,100 and $7,500 in the short term. With the upside resistance being first at $8,700 to get out of the channel, and then $10,500 and $11,050, respectively.
However, one has to question the validity of such drastic price action over the weekend, and next week could see a monstrous bullish rise, much akin to the power move we saw from Bitcoin on Oct. 25, 2019, when the price jumped from $7,400 to $10,500.
But what are some of the leading indicators telling us?
Relative Strength Index (RSI) indicator
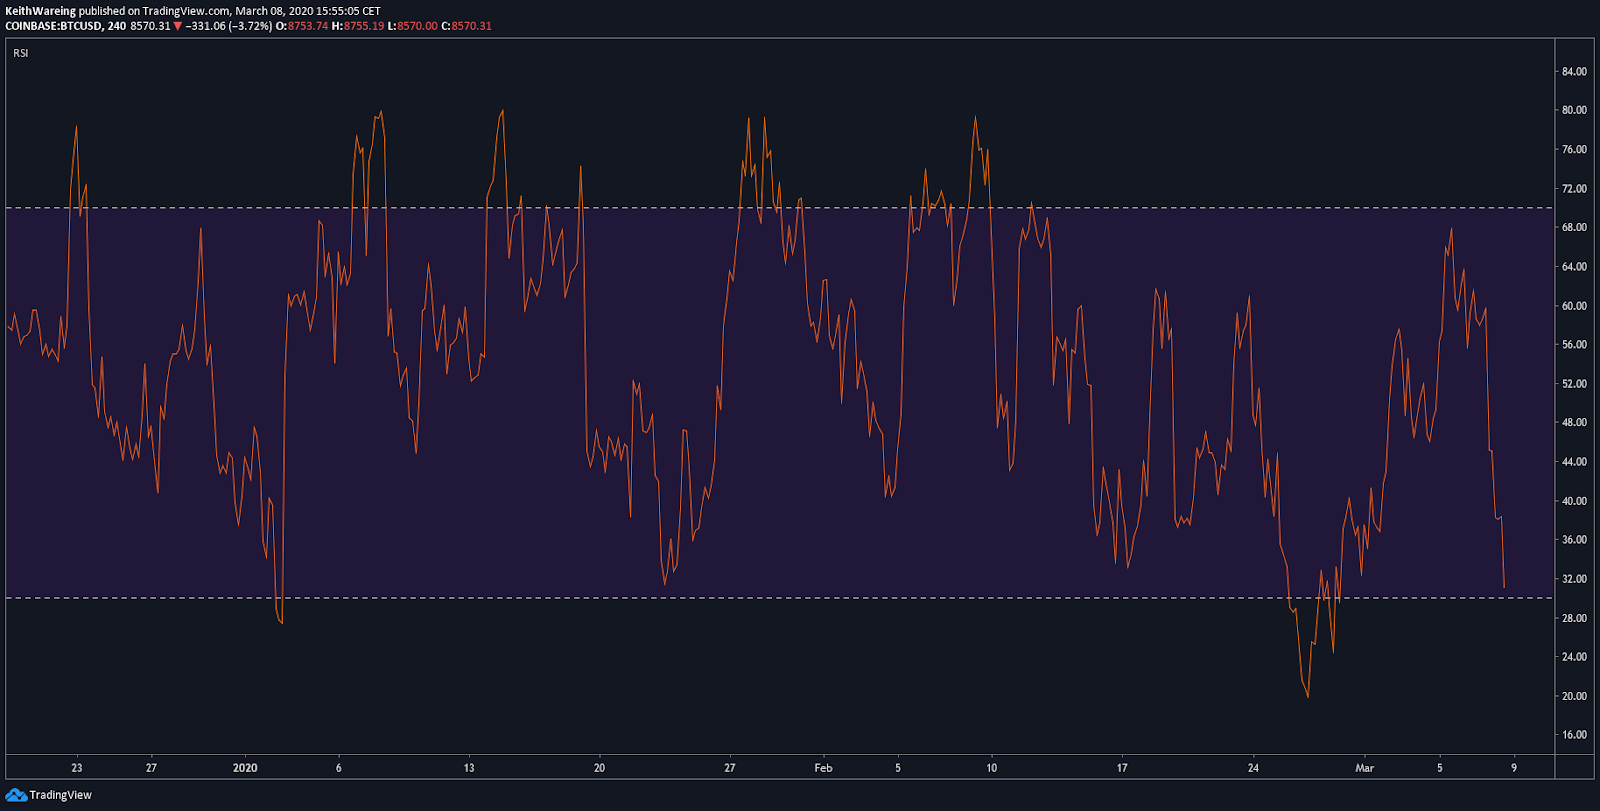
BTC USD RSI 4-hourly Source: TradingView
The Relative Strength Index (RSI) Indicator on the 4-hour shows that we could have some distance left to fall with a reading of just above 31. This tells us that Bitcoin is approaching heavily oversold on this key timeframe, and historically it must break below 30 before seeing a reversal.
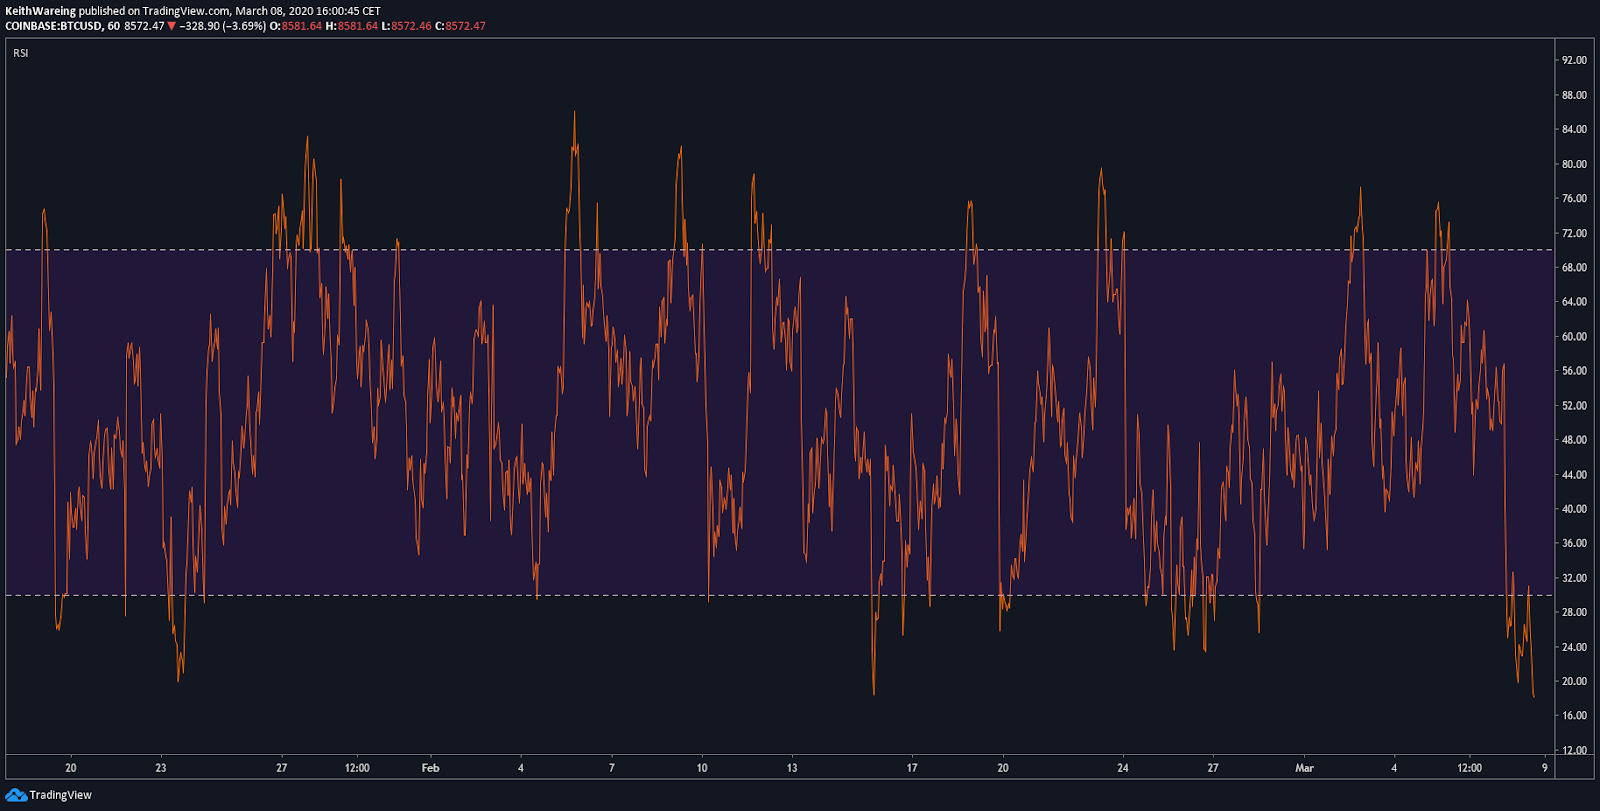
BTC USD RSI 1 hour Source: TradingView
The hourly, however, looks massively oversold, reading at 18.62, which is approaching levels we haven’t seen since Feb. 15.
One would hope to see a reversal at this stage. However, despite the RSI appearing to pivot on this date, the Bitcoin price did not, and continued to fall from $9,700 to $8,400 over a period of two weeks.
But what does the Moving Average Divergence Convergence (MACD) Indicator tell us?
The MACD is looking set to cross bearish on the weekly
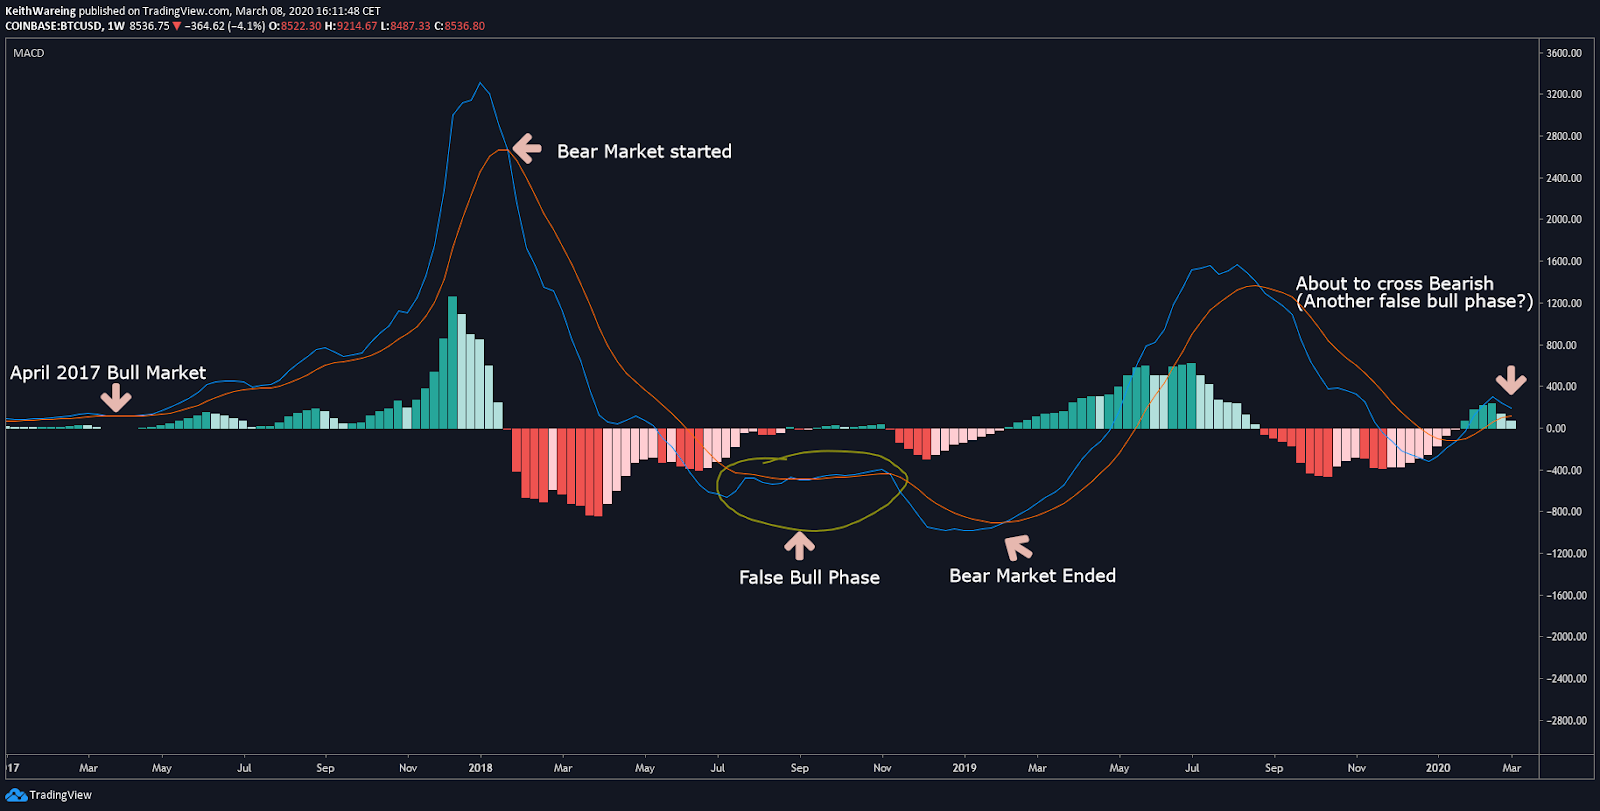
BTC USD weekly MACD Source: TradingView
As I have mentioned several times, the weekly MACD is a great indicator when looking to identify bull or bear trends. However, I expressed concerns back in January in my analysis stating that weekly MACD was exhibiting similar signs to that of the false bull phase we saw around August-September 2018.
During this phase, bulls were lured into a false sense of security, which saw Bitcoin fall from $8,000+ to sub $4K in a matter of weeks, and it appears my concern could have been valid.
However, in late 2018 there wasn’t an imminent halving of Bitcoin mining rewards around the corner like there is now. But then again, there also wasn’t a global pandemic either. However I’m yet to see any major correlation between Covid19 and the Bitcoin price as of yet, so I’ll not be going down that road just yet.
The week ahead should give us some answers as we have two historically bullish indicators ahead of us, and should they fail to increase the price of Bitcoin next week, perhaps we need to start looking at the reality of a potential global slowdown having a very negative effect on the price of Bitcoin.
The CME gap
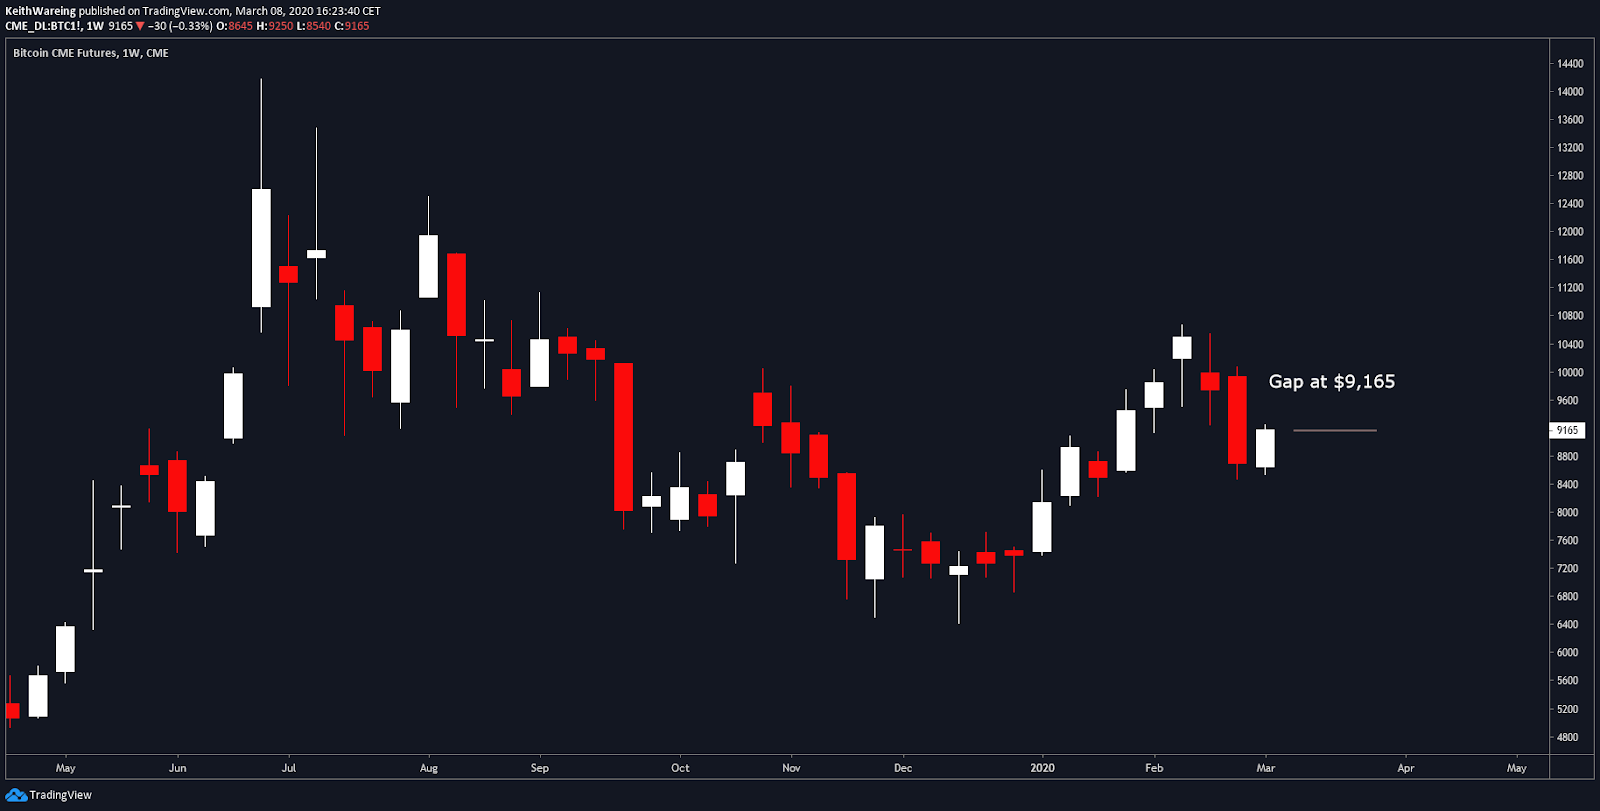
BTC USD CME weekly Source: TradingView
I’ve said it countless times, if you are not trading the CME gaps, “do you even crypto bro?” The CME gaps occur when the Chicago Mercantile Exchange closes for trading on a Friday evening and reopens on a Monday after large weekend moves, which leaves a gap in the charts.
There are many theories as to why gaps fill. One is that orders left on the books from the Friday prior remain unfilled, in this case, sell orders of Bitcoin at $9,165 need to be bought to fill the gap on the charts.
But if the market opens at $8,100, who would buy at a premium of $9,165? Potentially someone who has a long position on margin, that stands to profit from a guaranteed long that’s who. And in such an easy market to move, is it any wonder that historically 90% of CME gaps for Bitcoin get filled?
This isn’t the only bullish indicator though, there is another reliable indicator that has served as a crystal ball this year, and that is the mining difficulty.
Mining difficulty is set to explode next week
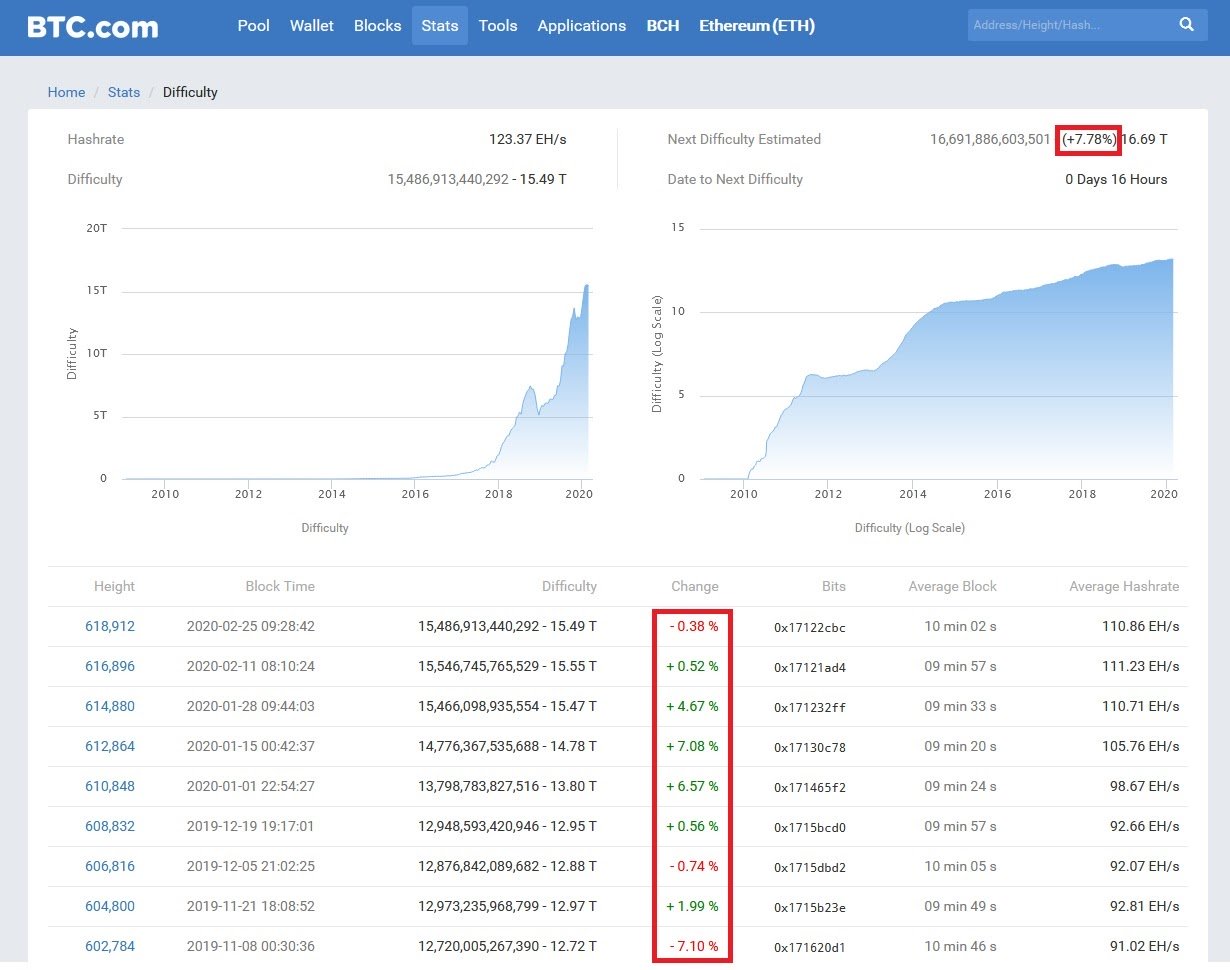
BTC mining difficulty. Source: BTC.com
Next week, the mining difficulty is set to increase by nearly 8% and that’s the most it has increased all year. In fact, it’s the most it has increased in the last 6 months, so this is a very positive sign for Bitcoin.
At the beginning of 2020, the Bitcoin mining difficulty kept increasing every two weeks by anywhere between 4% and 7% and, in turn, the price of Bitcoin followed; and typically this happens on the same day the increase was implemented.
If this follows next week, then Bitcoin could see a tremendous reversal, but only time will tell.
The week ahead for BTC price
The week ahead for Bitcoin is quite important for several reasons. Right now, with the state of the global panic, there is a lot of irrational behavior (for example, how much toilet paper did you buy this week?)
As such technical analysis might be completely useless, and that’s a very real fact that people should consider this forthcoming week. If the CME gap and BTC difficulty increase have no impact, we might see that $4K Bitcoin I spoke about in January after all.
In terms of resistance this week, Bitcoin first needs to reclaim $8,700 and flip this to support again to break out of this bearish channel. After this, I would be looking to $9,200 and then $10,500 as the key levels to break, with the last heavy area of resistance being around $11,050 before we finally go to the moon.
On the downside, $8,100 and $7,500 are the two levels most likely to see support formed, and if $7,500 fails to hold, it opens up $4,000 in 2020 once again as a possible scenario.
The views and opinions expressed here are solely those of @officiallykeith and do not necessarily reflect the views of Cointelegraph. Every investment and trading move involves risk. You should conduct your own research when making a decision.
 cointelegraph.com