- Bitcoin price shows no signs of a directional bias as it hovers around $66,000.
- The 2019 BTC price fractal hints at a potential correction should the US Fed cut interest rates.
- Investors can expect a retest of the $60,000 to $45,000 levels depending on the severity of the nosedive.
There aren’t any high-impact events that could sway the market this week. So, let’s focus on the cryptocurrency market’s lack of directional bias. From a big-picture perspective, the reason for this uncertainty could be attributed to the US Federal Reserve or the macroeconomic landscape. But Bitcoin (BTC) is also to blame for this directionlessness and choppy market outlook.
US Fed’s fight against inflation
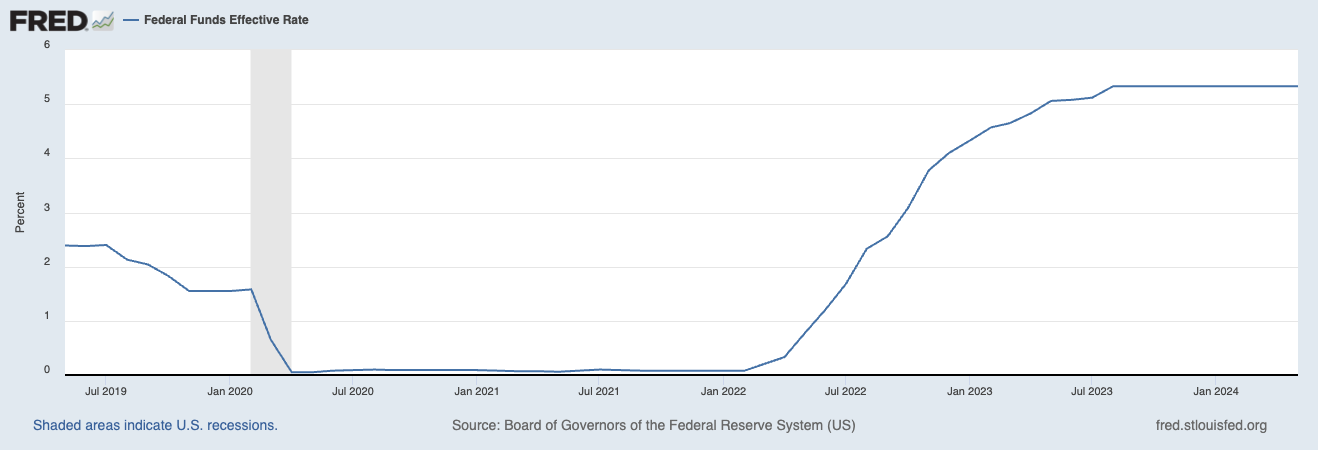
The Fed has been battling inflation since the 2020 pandemic and has brought it down from a peak of 9.1% in mid-2022 to 3.3%. Still, the central bank has failed to bring it down to its 2% target despite keeping the federal funds target rate, aka interest rate, steady at the 5.25% to 5.50% range since July 2023.

US Federal Reserve fed funds rate
Historical evidence suggests that if interest rates remain higher for longer, it could break the economy, triggering a marketwide sell-off.
The US Fed ramped up interest rates from 0.75% in January 2017 to 2.5% in December 2018. After this, the rates remained at the peak level till late July 2019. However, the Fed decided to cut interest rates in February 2020 close to zero in order to cushion the effects of the marketwide nosedive due to the COVID-19 pandemic.
BTC/USD 1-day vs Fed Funds Rate chart" src="https://cnews24.ru/uploads/df6/df67f3056b5a1079583363a7ccf2841f52fb687b.png" size="3288x1850">
BTC/USD 1-day vs Fed Funds Rate chart
Interestingly, the crypto markets were the first to crash and began their descent after the Fed started cutting the interest rates in July 2019. It makes sense that BTC formed a local top in 2019 and crashed as investors would choose to offload the riskiest assets first. So, the Fed pivot created a risk-off scenario, leading to a correction for crypto.
BTC 2019 fractal
For now, the interest rate has remained at 5.25% to 5.50% for almost a year, with rumors of a Fed pivot to lower rates around the corner. This upcoming development has caused many to speculate that crypto could be forming a local price top.
Such a development could see BTC tag the $61,000 to $60,000 level first. Beyond this, BTC could slide as low as 24% to $45,400, especially if the 2019 fractal repeats.
BTC/USD 1-day, 12-hour chart" src="https://cnews24.ru/uploads/214/2141696bcb440812eedef8ac39e2da63f5527134.png" size="3288x1856">
BTC/USD 1-day, 12-hour chart
A complete invalidation of this bearish outlook could occur if BTC manages to overcome the $71,150 resistance level and flip it into a support floor. Such a move could see BTC contest the all-time high of $73,794 and set up a new one at $80,000.
 fxstreet.com
