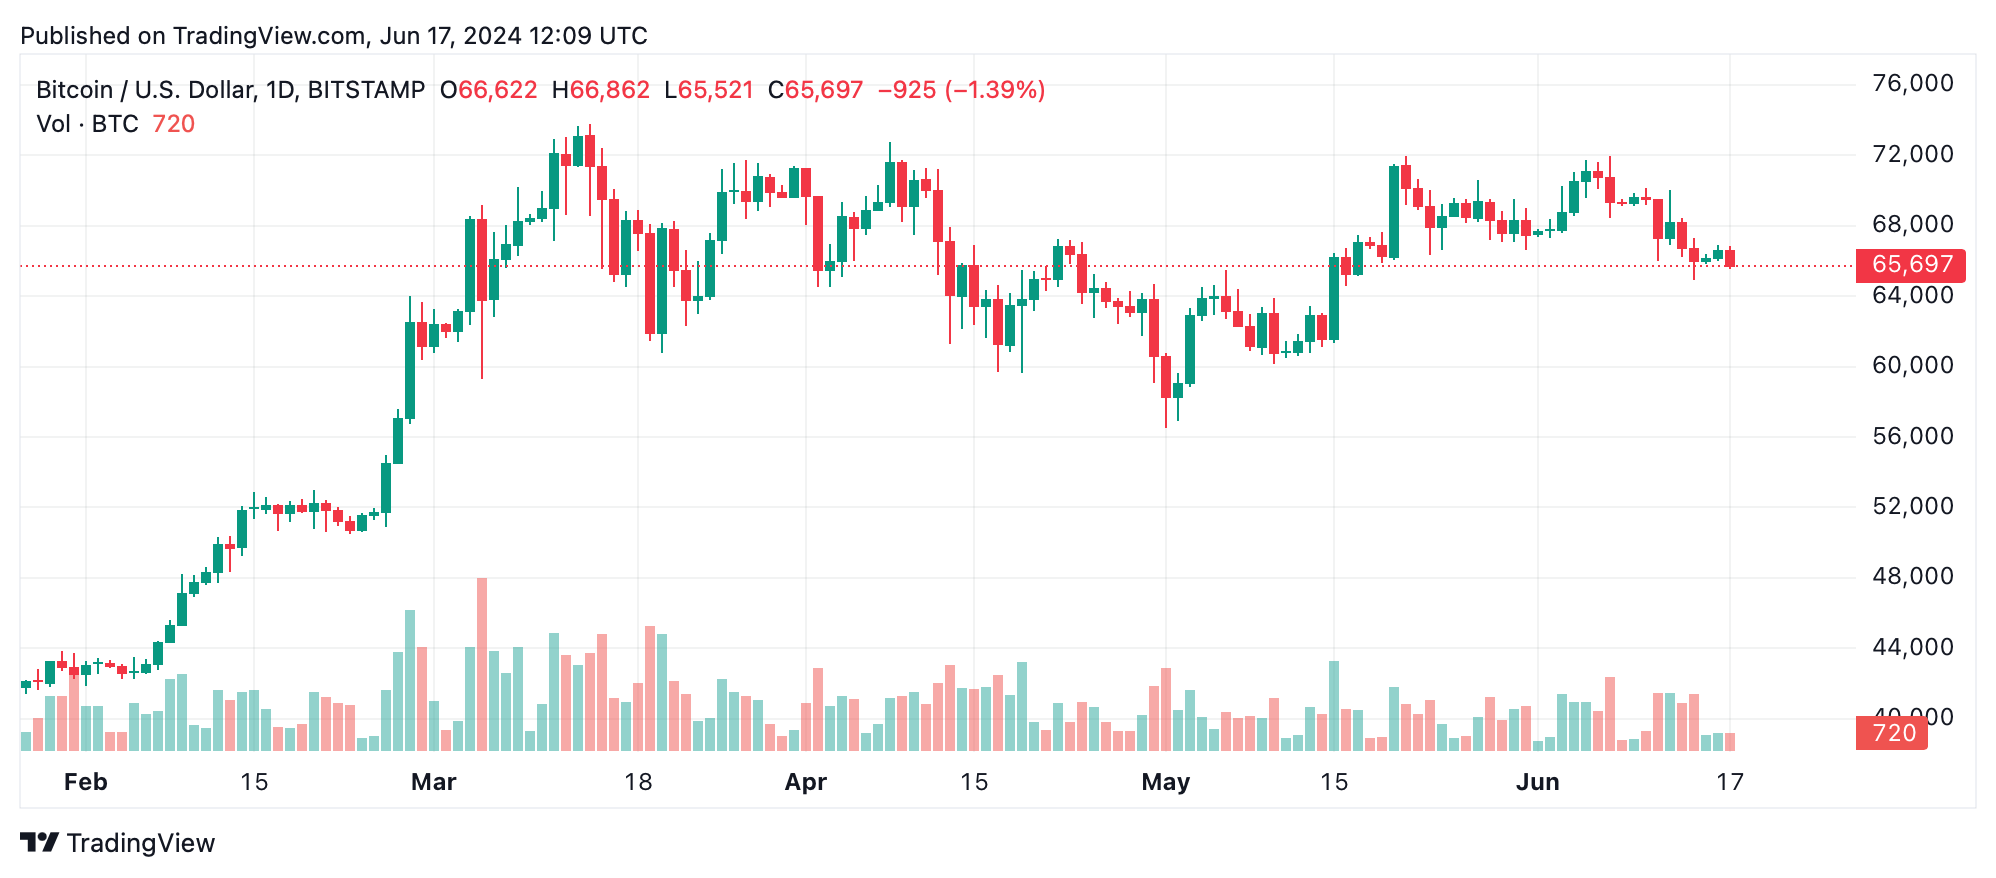
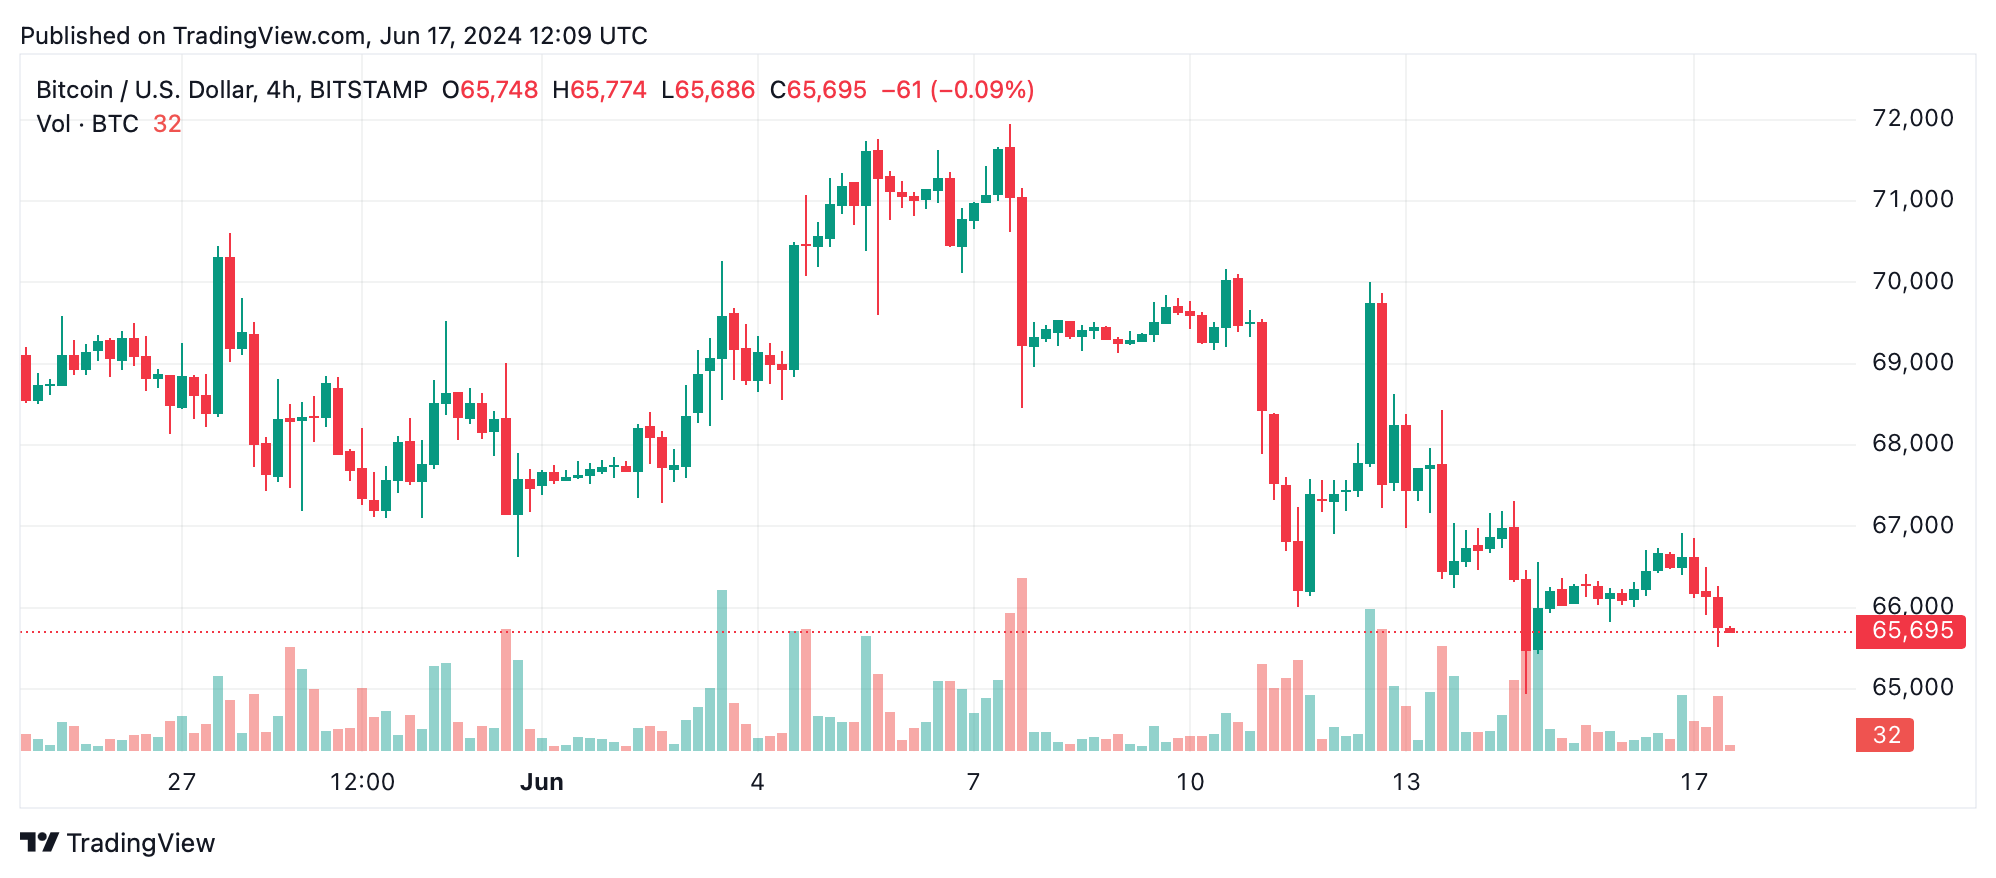
As of June 17, 2024, Bitcoin is trading at $65,805, with a 24-hour intraday range between $65,518 and $66,992. The cryptocurrency market is displaying notable volatility, as evidenced by significant trading volume and fluctuating price levels.
Bitcoin
Bitcoin’s 1-hour chart reveals a clear downward trend following a recent peak, with key resistance and support levels at $66,914 and $65,521, respectively. Trading volume spikes correlate with large downturns, indicating substantial selling pressure. A potential entry point could be identified after confirmed support at $65,450 if the price shows upward movement with increasing volume.

Mirroring bitcoin’s 1-hour chart, the 4-hour timeframe also exhibits a downtrend post-peak, with resistance at $70,007 and support at $64,936. The volume analysis indicates strong selling momentum, with significant spikes during major drops. Entry considerations might be based on consolidation around the $64,936 support, coupled with bullish reversal signals.

The daily chart provides a broader perspective, illustrating a bearish correction following an uptrend. Resistance and support levels are identified at $71,958 and $61,322, respectively. High trading volumes during key movements suggest heightened market interest. A long-term entry could be viable at the $61,322 support, assuming it holds and reversal signs are evident.
Oscillators present a mixed outlook, with the relative strength index (RSI) at 42 (neutral) and the commodity channel index (CCI) at -120 (neutral). The momentum indicator suggests a buy, while the moving average convergence divergence (MACD) level indicates a sell, reflecting market uncertainty.
Moving averages (MAs) predominantly signal selling pressure: exponential moving averages (EMA 10, 20, 30) and simple moving averages (SMA 10, 20, 30) all advocate for bearishness. Longer-term indicators, such as the EMA (100) and SMA (200), suggest a buy, hinting at potential recovery prospects.
Bull Verdict:
Despite the prevailing bearish sentiment indicated by short-term moving averages and oscillators, bitcoin’s longer-term moving averages suggest potential recovery. If support levels hold and bullish reversal signals emerge, a rebound could be on the horizon. Traders looking for long-term growth might find entry opportunities at current lower levels, anticipating a future upward trend.
Bear Verdict:
The overall technical analysis highlights significant selling pressure, with downward trends evident across multiple timeframes. Key resistance levels remain unbreached, and volume spikes correspond to strong selling momentum. Traders should exercise caution and consider exiting positions if bearish patterns persist, with the potential for further price declines in the near term.
 news.bitcoin.com
