
Bitcoin, priced at $70,875, has exhibited strong bullish trends within the last 24 hours, with intraday prices ranging from $68,819 to $71,339. The cryptocurrency boasts a market capitalization of $1.39 trillion and a 24-hour trade volume of $37.14 billion. Analyzing the 1-hour, 4-hour, and daily charts alongside oscillators and moving averages indicates continued positive momentum, albeit with some consolidation.
Bitcoin
Bitcoin’s 1-hour chart displays a strong upward movement, with prices advancing from around $68,553 to $71,339 before entering a consolidation phase. The increasing volume during the ascent suggests strong buying interest. However, the volume tapers off during consolidation, indicating a temporary pause in momentum. Bullish patterns, with higher highs and higher lows, confirm the upward trend. Recent drops around the $71,000 mark could signify short-term profit-taking or a brief consolidation.
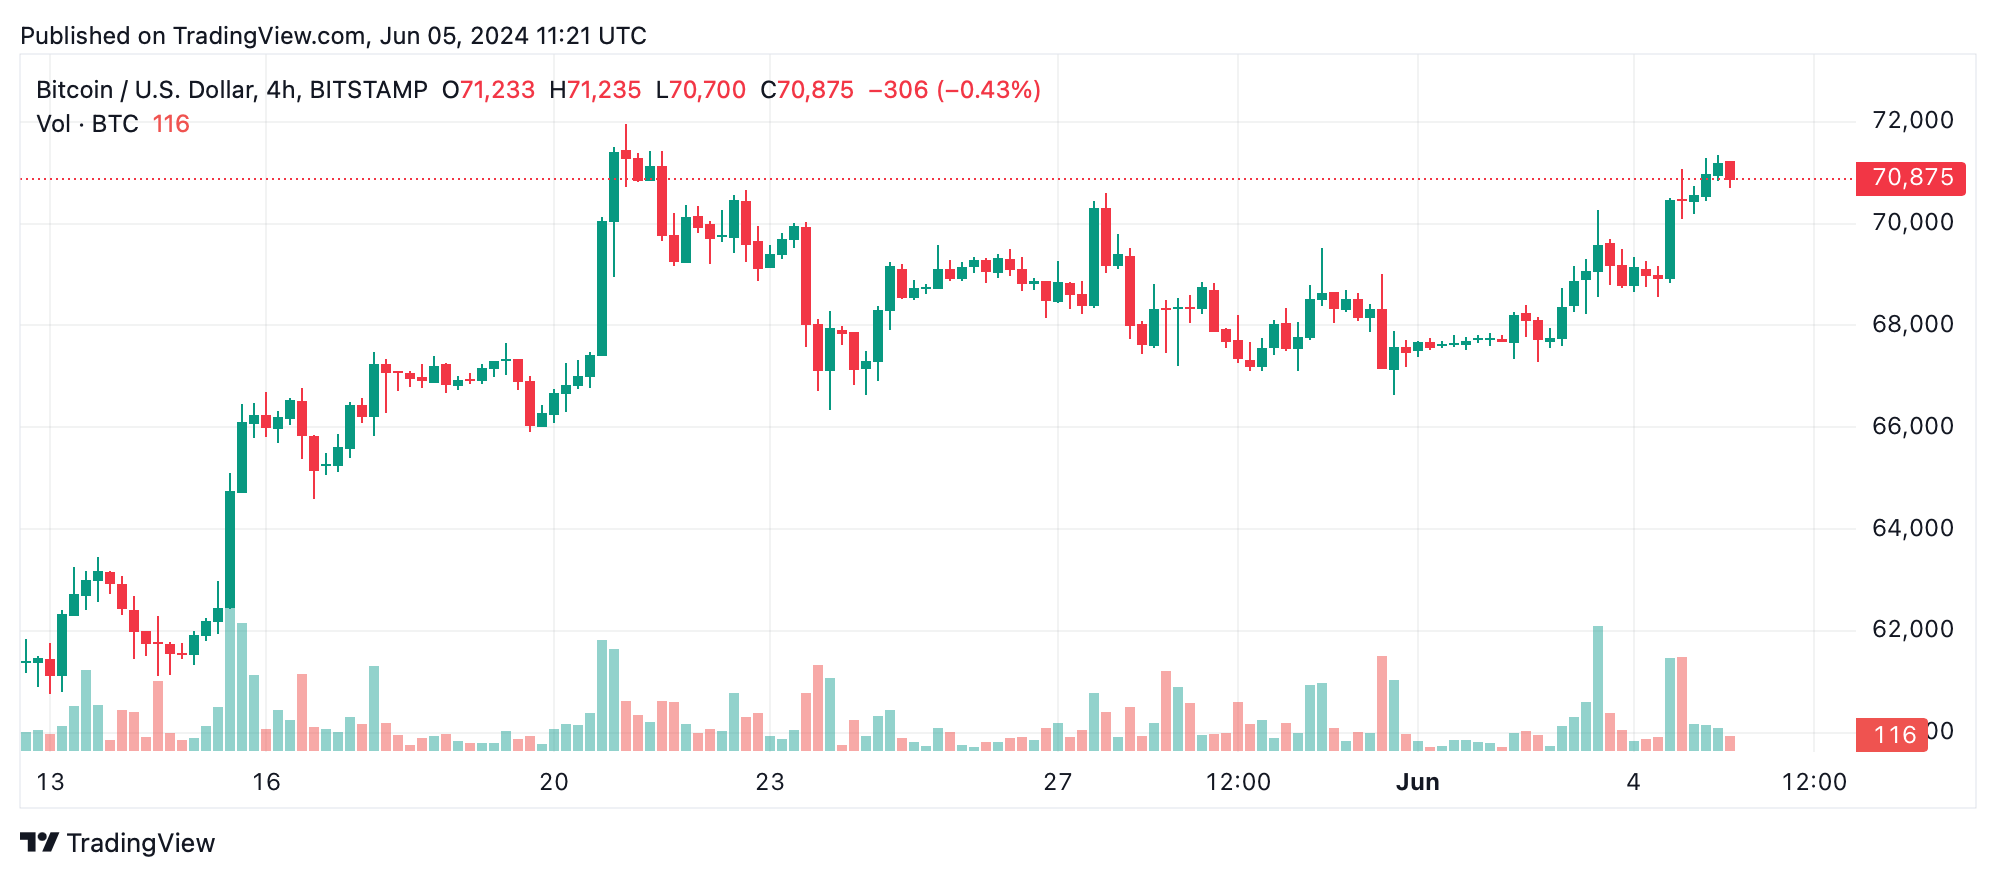
On the 4-hour chart, bitcoin has risen significantly from $66,624 to $71,339, with consolidation near the highs. A volume spike during the initial rise points to solid buying interest, while lower volumes during consolidation suggest a potential continuation of the trend. Bullish candlesticks dominate the chart, with recent sessions showing consolidation, potentially forming a base for the next leg up if volume increases.
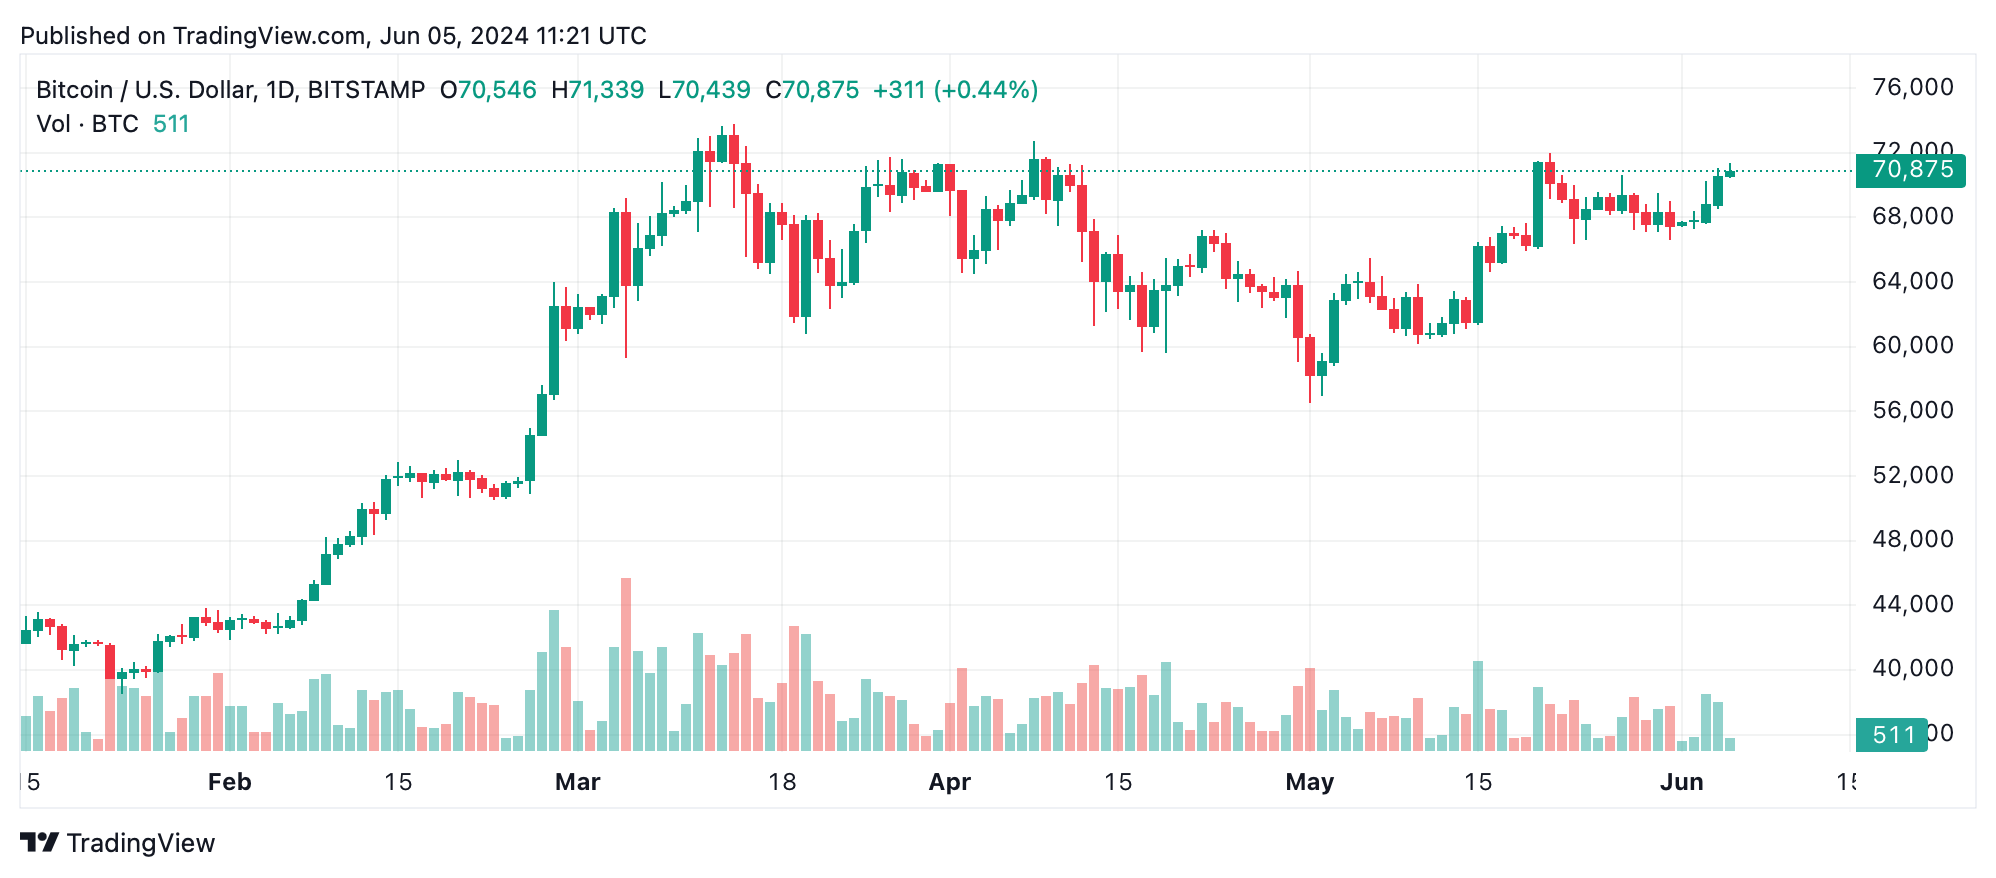
The daily chart of bitcoin reveals a notable rally from around $56,500 from May 1 to yesterday’s $71,958, followed by a minor pullback and subsequent consolidation. Volume analysis shows higher activity on green days, indicating stronger buying interest, while red days exhibit relatively lower volumes, a bullish sign. The pattern of higher highs and higher lows reflects a strong uptrend, with recent consolidation near the highs hinting at further upward movement.
The oscillators and moving averages support the bullish outlook. The Relative Strength Index (RSI) is neutral, suggesting no immediate overbought or oversold conditions. The Stochastic and commodity channel index (CCI) are also neutral, while the awesome Oscillator, momentum, and moving average convergence divergence (MACD) levels indicate buy signals. All major moving averages—both simple and exponential across various periods—show buy signals, reinforcing the bullish sentiment.
Bull Verdict:
Bitcoin’s current technical indicators and chart patterns strongly suggest a bullish trend. With positive momentum across various timeframes and support from key oscillators and moving averages, the cryptocurrency is poised for further gains. Traders should look for entry points during consolidation phases to capitalize on the anticipated upward movement.
Bear Verdict:
While bitcoin has shown strong bullish signals, the recent consolidation and potential resistance near $72,000 could indicate a slowing momentum. If the price fails to break above resistance levels or if volume decreases significantly, a deeper pullback could occur. Traders should exercise caution and be prepared for possible downward corrections.