
Over the past hour, bitcoin’s price has ranged from $68,915 to $69,121, with an intraday spread between $67,440 and $69,305. The 24-hour trading volume for bitcoin (BTC) is $23.02 billion, indicating robust market activity. The market capitalization of bitcoin remains strong at $1.36 trillion.
Bitcoin
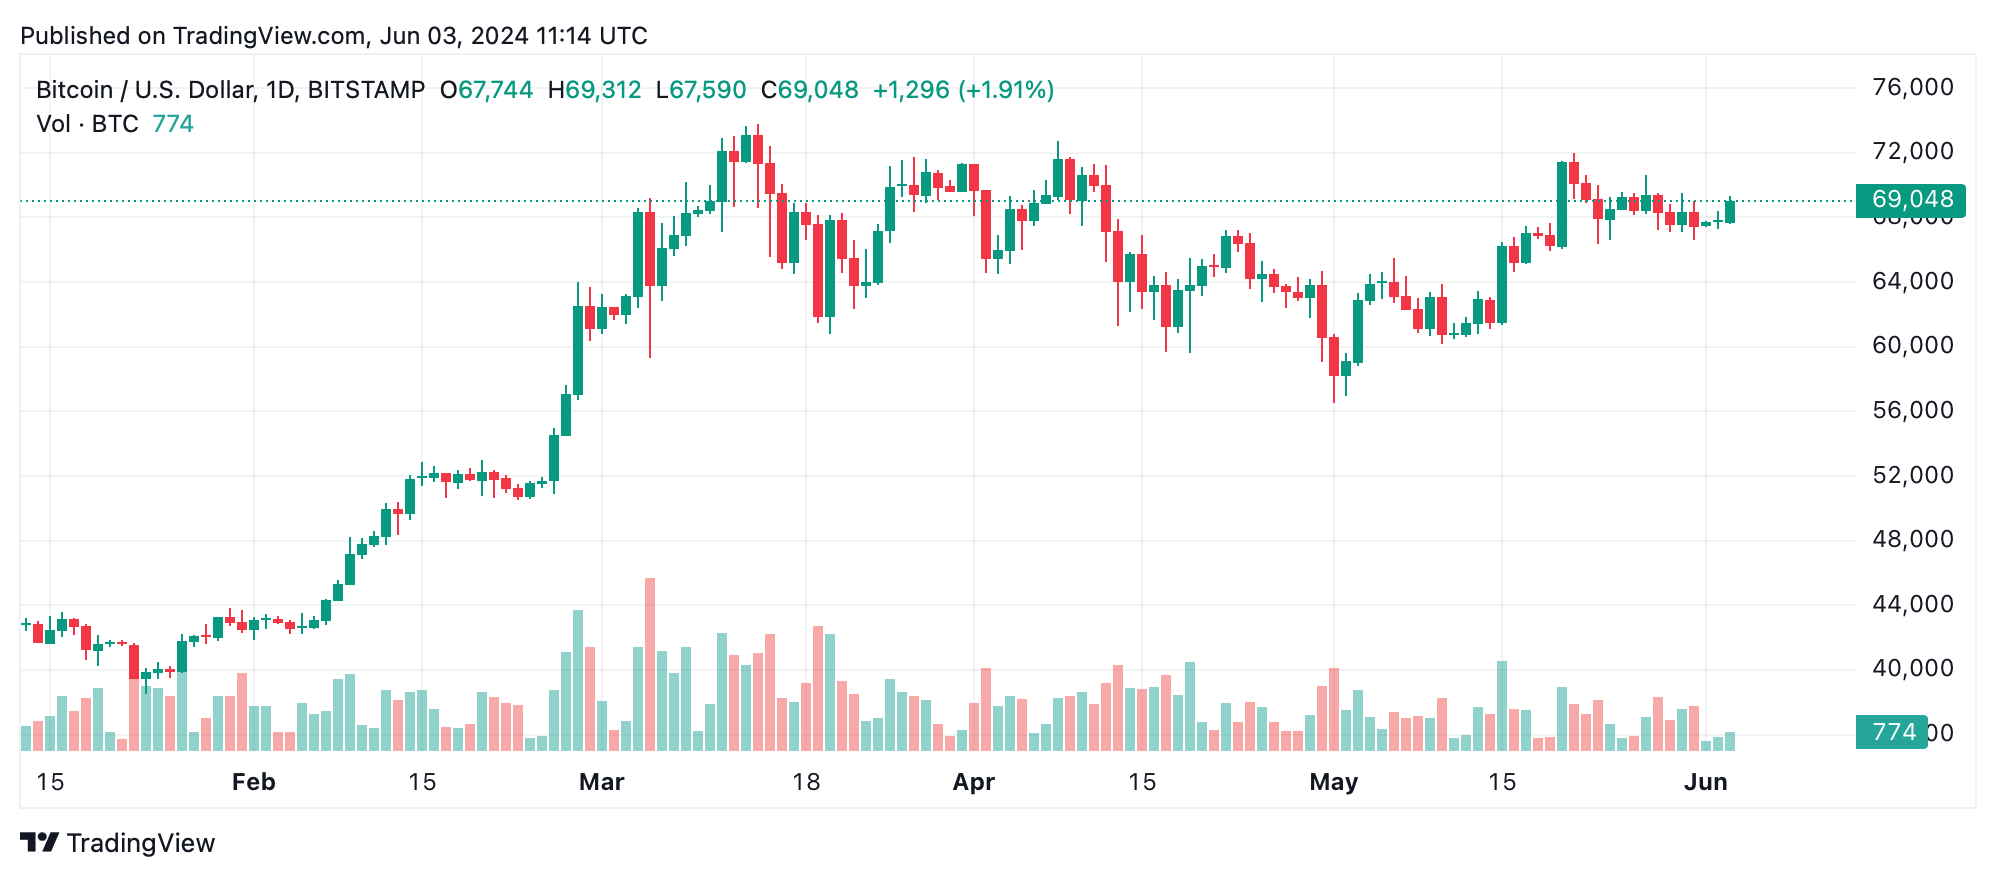
Bitcoin’s daily chart highlights a major uptrend starting in early May, peaking at $71,958, followed by a slight pullback and consolidation near the $68,000-$70,000 range. The daily chart shows support is firmly positioned at $66,000, with resistance at the recent high of $71,958. The mix of ups and downs suggests ongoing market contention, while a reduction in volume during consolidation hints at a temporary pause in the upward momentum.
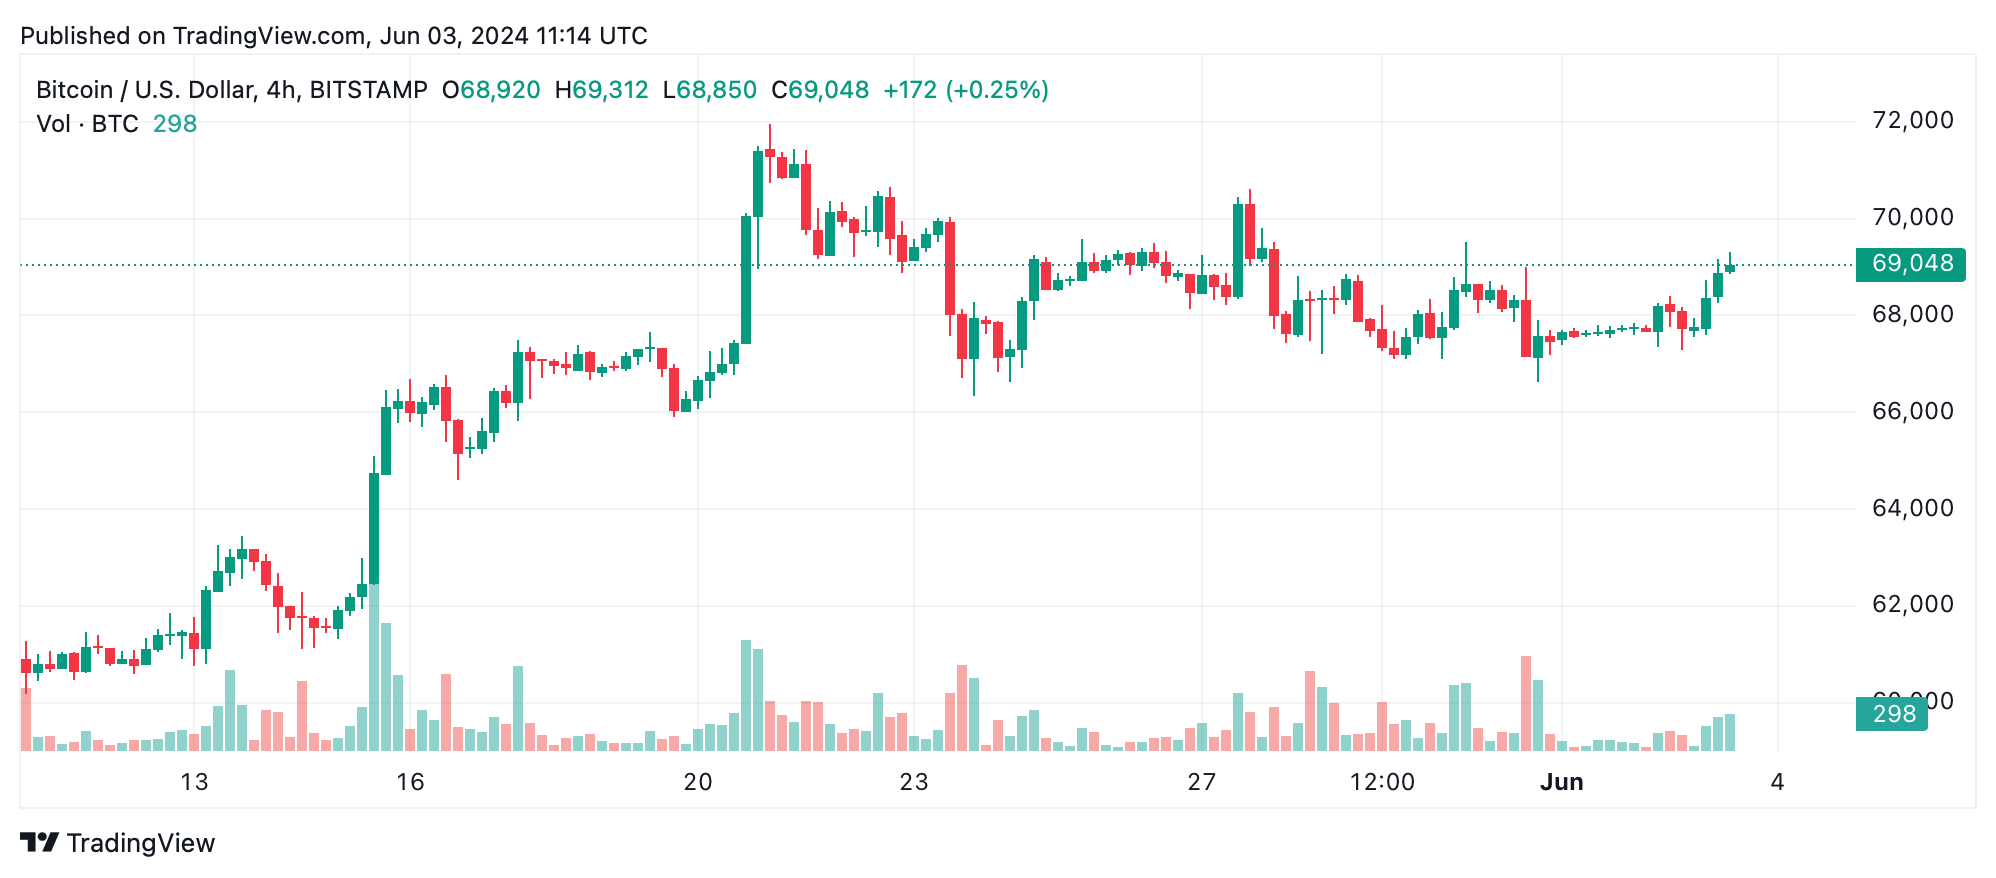
The 4-hour chart reveals a correction from $69,524 to $66,624, followed by a steady recovery. Support at $66,624 and resistance at $69,524 define the current trading range. Recent price upswings show increased buying pressure, suggesting a bullish sentiment at the lower end of this range. Volume analysis supports this, with higher volume during the upticks indicating continued buying interest.
Analyzing the 1-hour chart, short-term fluctuations are evident with a recent low at $67,281 and a recovery to $69,312. Support is noted at $67,281 and resistance at $69,312. The consolidation below $69,000 with decreasing volume signifies market indecision, which may precede a breakout or further consolidation, contingent on broader market forces.
Oscillators provide a mixed outlook. The relative strength index (RSI) at 57 and the Stochastic at 35 suggest neutral conditions. However, the momentum indicator at 377 signals a bullish sentiment, countered by the moving average convergence divergence (MACD) level at 939 indicating a sell. These mixed oscillator signals underscore the need for cautious trading strategies.
Moving averages (MAs) paint a predominantly bullish picture. Short-term (10-day) and medium-term (20- to 50-day) moving averages all signal a buy, with prices consistently above these averages. Long-term indicators (100- and 200-day) also reflect a bullish sentiment, further reinforcing the current uptrend despite the consolidation phase.
Bull Verdict:
Given the strong buying interest at key support levels, along with positive signals from multiple moving averages, bitcoin appears poised for further gains. The consolidation phase may serve as a foundation for the next upward movement, potentially challenging recent highs.
Bear Verdict:
Despite the bullish sentiment from moving averages, mixed signals from oscillators and a notable consolidation phase suggest caution. If bitcoin fails to break above the $70,000 resistance level, a deeper correction toward the $66,000 support could materialize, indicating a potential bearish trend.