
Bitcoin’s valuation presently resides at $68,402, boasting a market capitalization of $1.34 trillion and a 24-hour trading volume of $23.93 billion. Throughout the previous day, BTC’s price has maintained a tightly consolidated triangular pattern.
Bitcoin
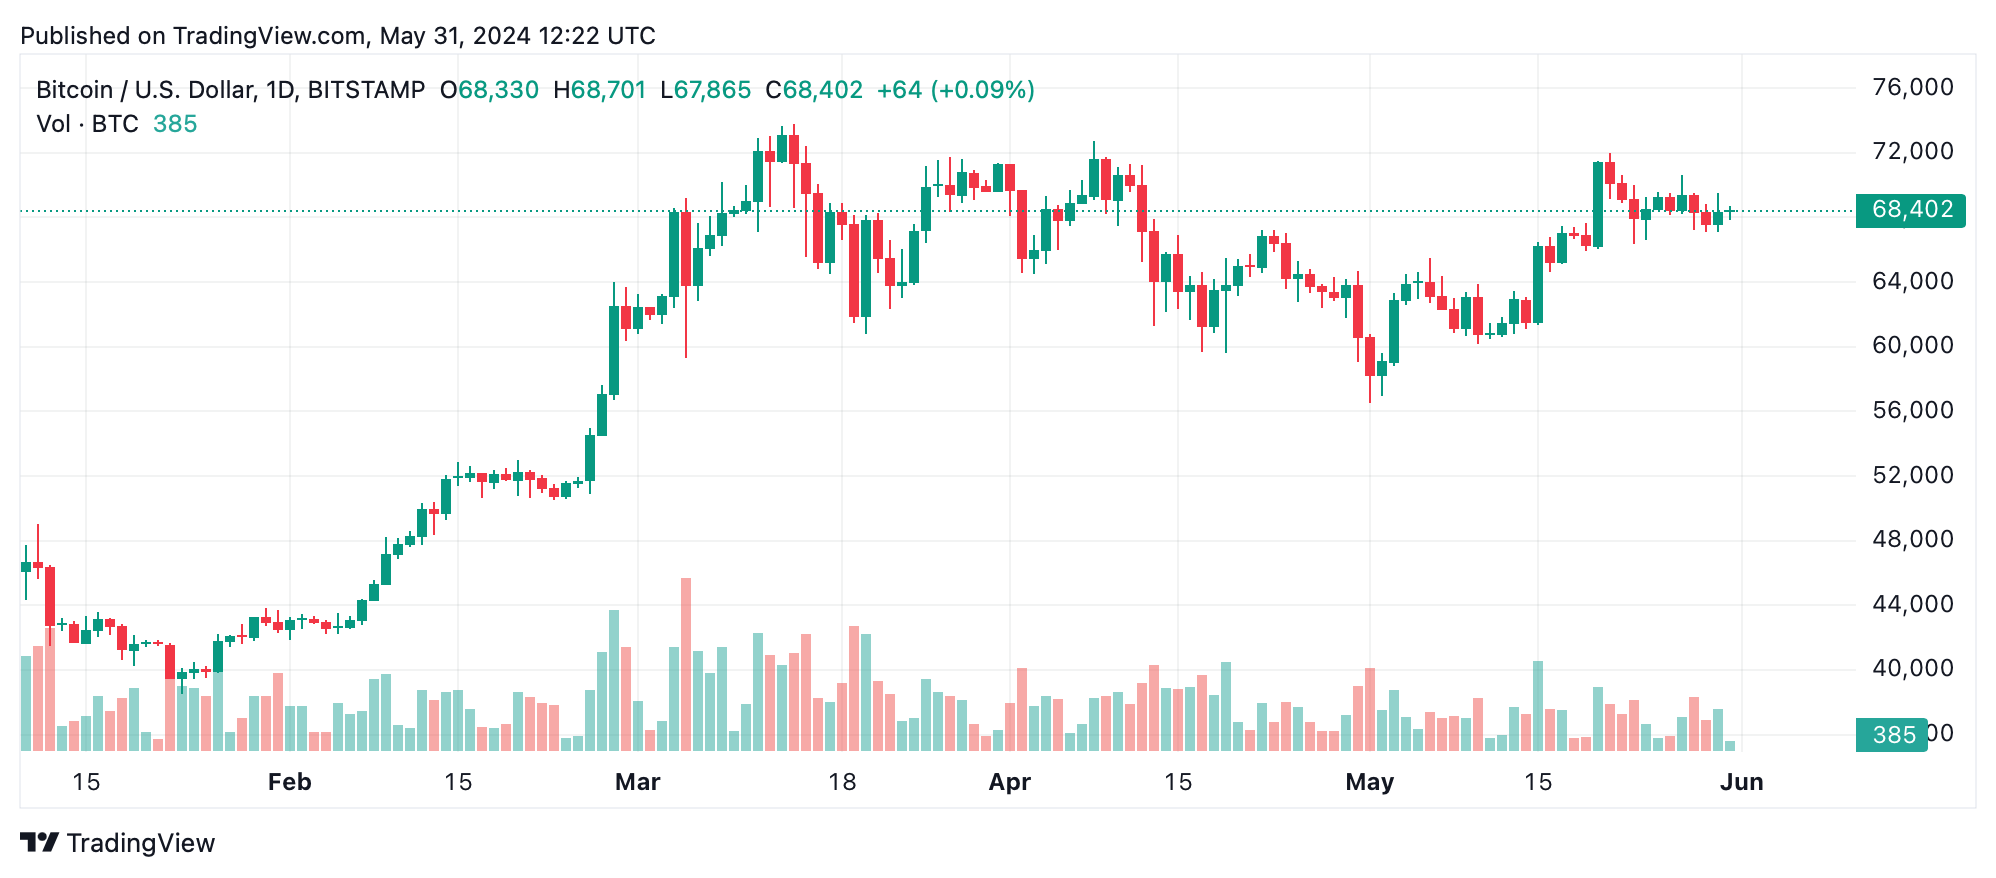
Bitcoin’s (BTC) daily chart reveals a market that has transitioned from a significant rally to a consolidation phase. After an impressive rise from $56,500 on May 1, to $71,958 on May 20, bitcoin’s price has fluctuated within a narrower range, indicating a period of market indecision. Key resistance stands at $71,958, while support has shifted from $56,500 to around $66,000. Trading volume has diminished during this consolidation, suggesting reduced market activity.
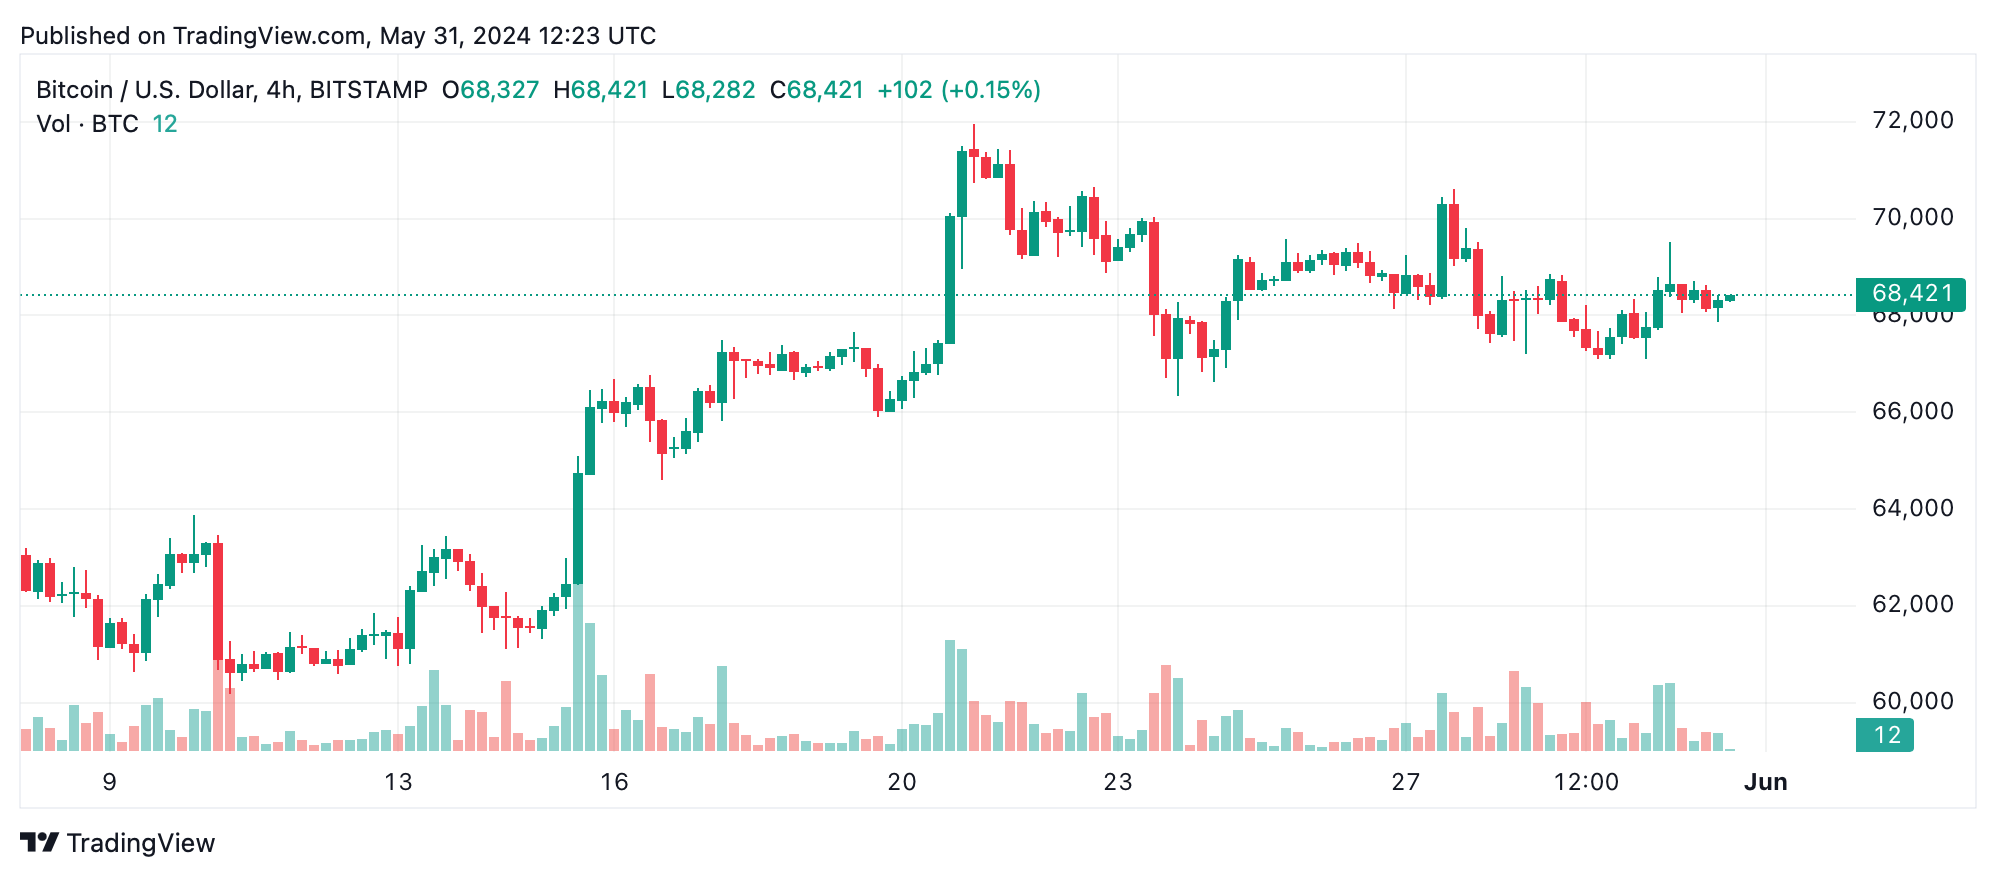
On the 4-hour chart, BTC exhibits a short-term bullish trend, characterized by higher highs and higher lows, peaking at $70,601. This is followed by a corrective phase with lower highs and lows, reflecting increased selling pressure. The primary resistance is at $70,601, and support is identified at around $67,096. Significant volume spikes at these levels suggest substantial trading activity, which traders should monitor closely.
The hourly chart offers a micro perspective within the larger daily and 4-hour trends. A recent dip to $67,105 was followed by a minor rally to $69,524 and a subsequent pullback, indicating short-term fluctuations. Key resistance is at $69,524, with support around $67,105. Candlestick patterns show signs of consolidation, with small bullish and bearish engulfing patterns suggesting short-term movements.
Oscillators present a mixed picture. The relative strength index (RSI) is at 55, indicating a neutral stance, while the Stochastic oscillator is at 42, the commodity channel index (CCI) at 38, and the average directional index (ADX) at 22 also suggests a lack of strong momentum in either direction. The awesome oscillator is at 3506, and the momentum is at -1830, indicating a positive signal, whereas the moving average convergence divergence (MACD) level at 1167 suggests a bearish signal.
Regarding moving averages (MAs), the picture is more bullish. The exponential moving averages (EMAs) for 10, 20, 30, 50, 100, and 200 periods are all giving bullish signals. In contrast, the simple moving averages (SMAs) provide a mixed outlook: the 10 SMA at $68,529 indicates bearish momentum, while the 20 SMA at $67,226, 30 SMA at $65,527, 50 SMA at $64,872, 100 SMA at$ 65,400, and 200 SMA at $54,135 all suggest bullish sentiment. This alignment generally supports the market positivity, albeit with caution advised around the shorter-term SMAs.
Bull Verdict:
Given the prevailing bullish signals from the majority of the MAs and the potential for a breakout above the key resistance levels identified in the daily and 4-hour charts, the overall outlook for bitcoin remains positive. Traders might consider buying at support levels and watching for confirmation of a continued uptrend.
Bear Verdict:
Despite the bullish signals from most of BTC’s MAs, the mixed signals from the oscillators, including the MACD sell signal and the neutral stance of the RSI, suggest caution. The market consolidation and decreased volume could indicate the potential for further sideways movement or a pullback, advising traders to remain vigilant for signs of a downtrend.