
Bitcoin’s price on May 29, 2024, reflects a period of consolidation following recent volatility. The current price stands at $67,739 with an intraday range of $67,201 to $68,880. Technical indicators and moving averages provide a mixed outlook, indicating both potential stability and the possibility of future movements.
Bitcoin
Bitcoin’s 1-hour chart reveals a high of $69,513 and a low of $67,193. The sharp decline followed by sideways movement signifies a lack of strong momentum in either direction. Volume spikes are seen during the sharp movements, yet recent lower volumes suggest trader indecision. Key levels to monitor are the support at $67,200 and resistance at $69,500, as breaking these could determine short-term direction.
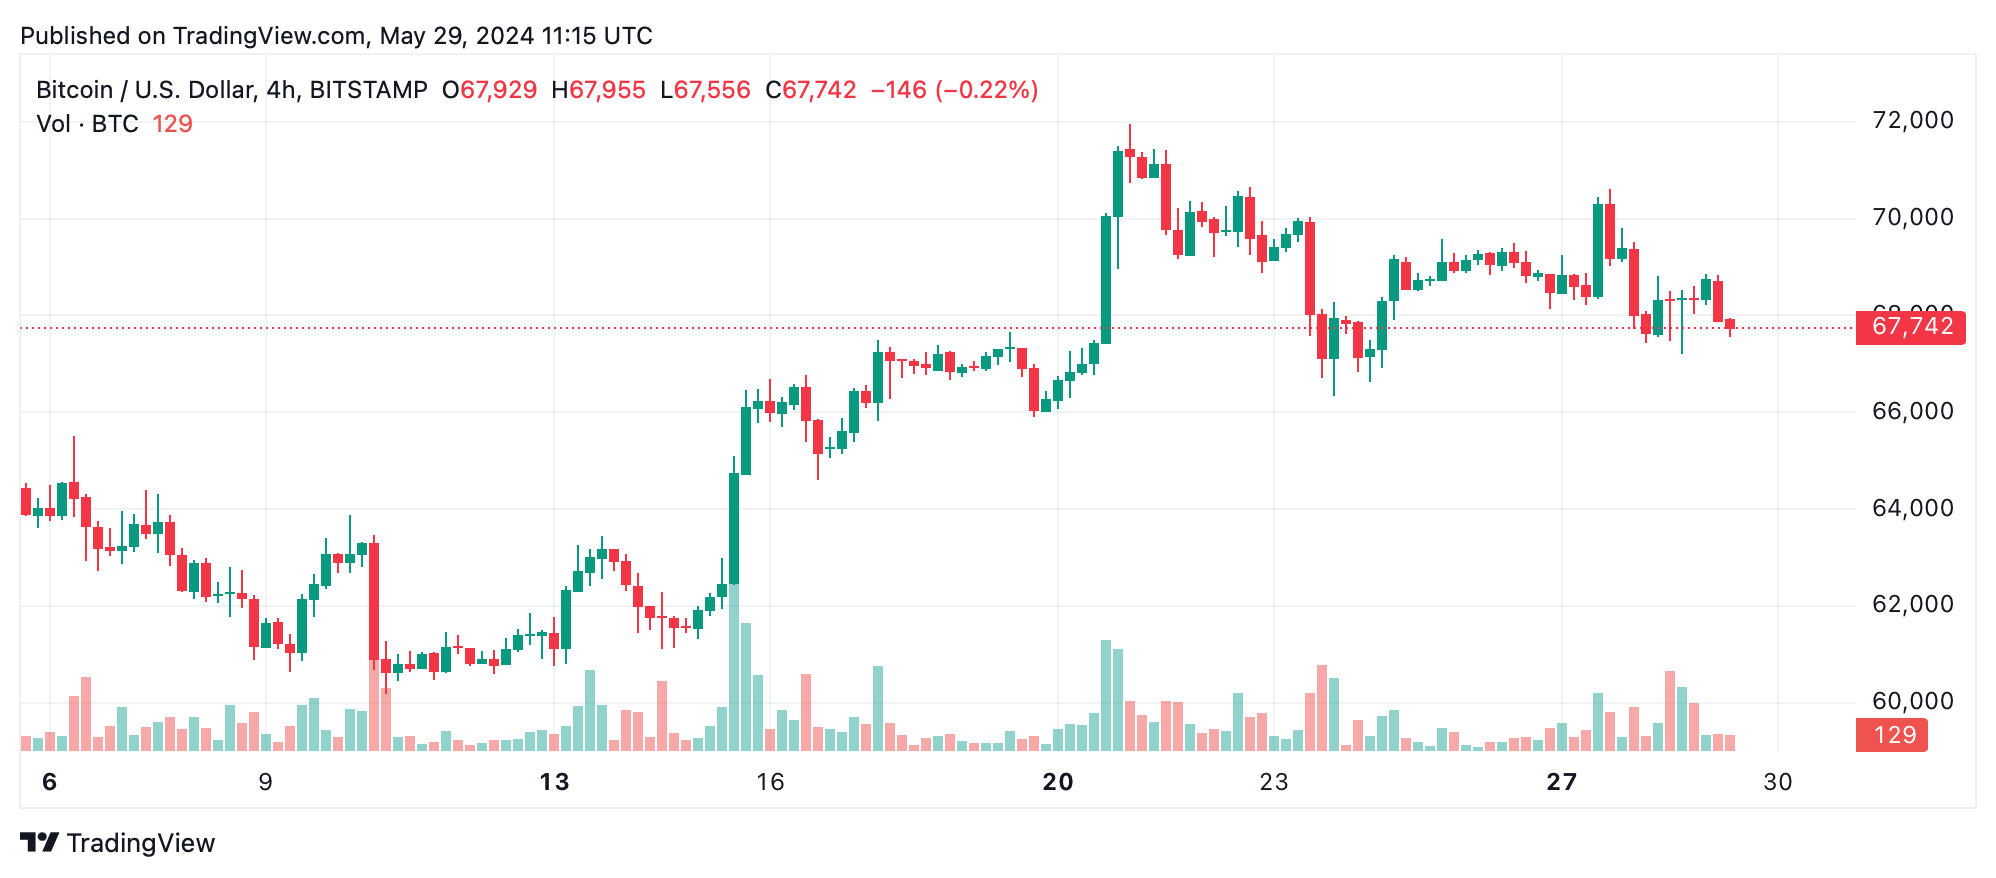
On the 4-hour chart, BTC reached a high of $70,601 and a low of $66,343. The price action indicates a significant bullish move followed by a consolidation phase with lower highs and higher lows, potentially forming a symmetrical triangle. The volume spikes during sharp price changes, followed by lower volumes during consolidation, emphasize the cautious sentiment prevailing in the market.
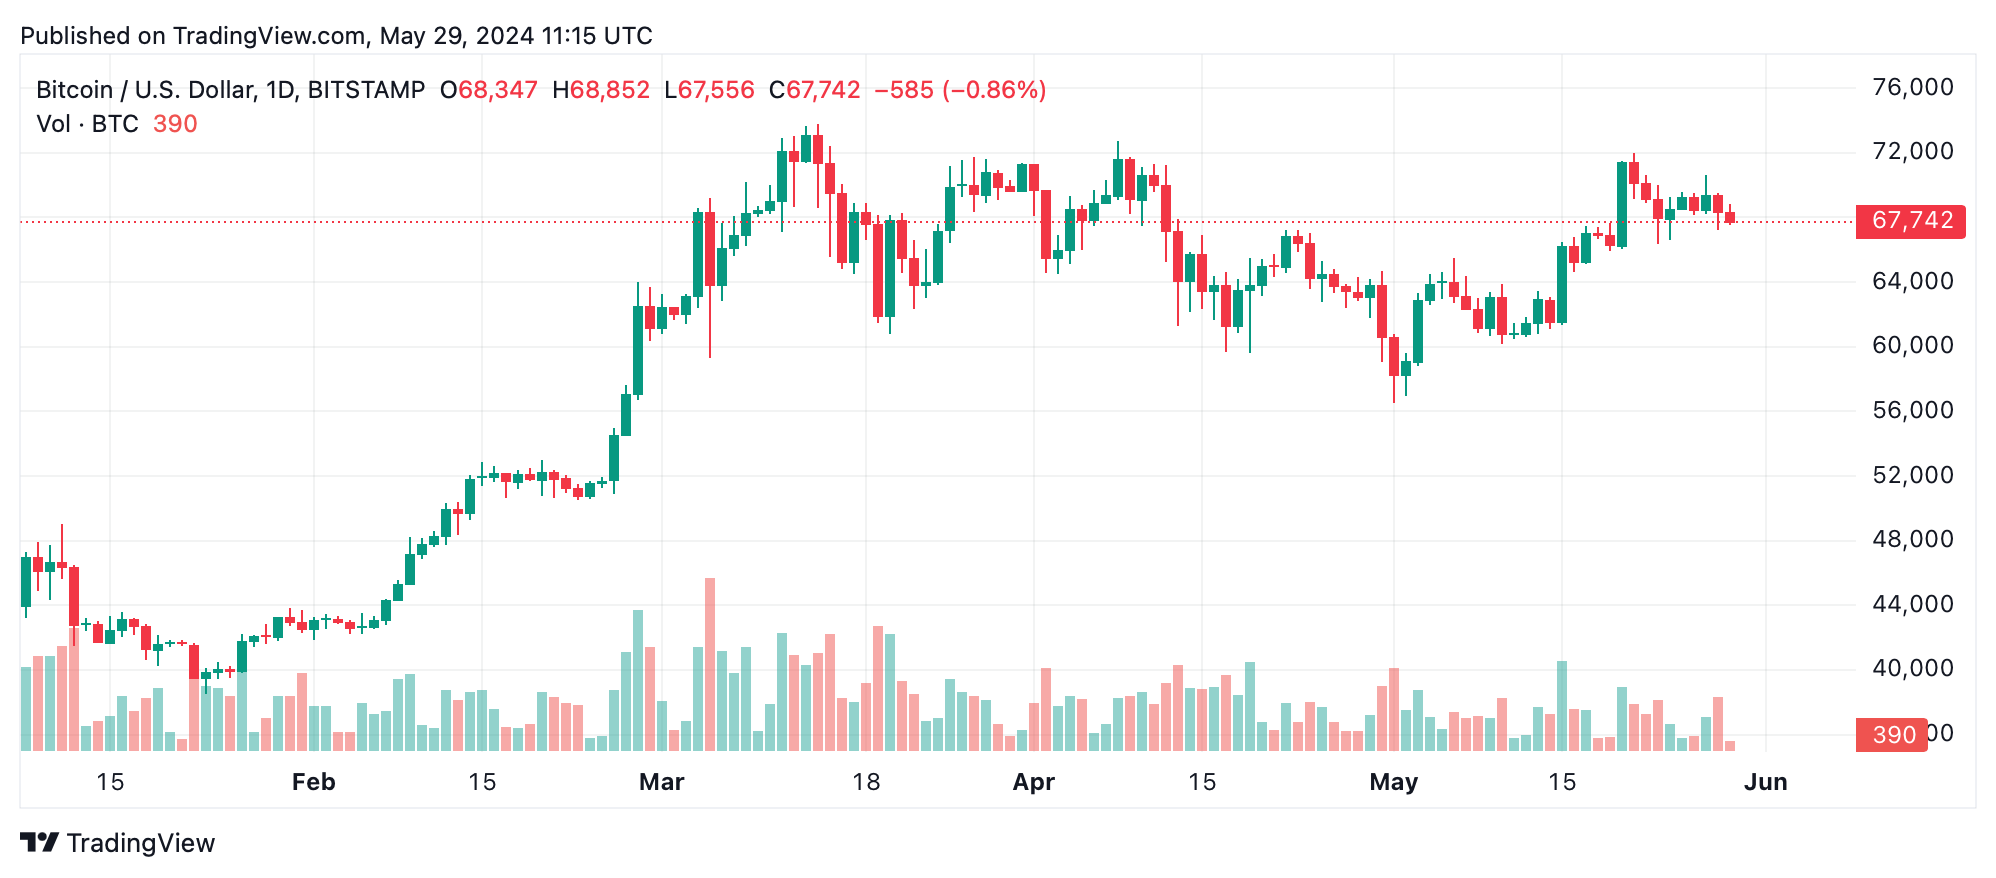
The daily chart provides a broader perspective, showing an overall uptrend from a low of $56,500 to a high of $71,958. Recently, the price has been consolidating in the $68,000 to $70,000 range. The volume analysis on the daily chart supports this consolidation phase, with lower trading activity indicating a temporary pause in the bullish momentum.
Analyzing the oscillators, the relative strength index (RSI) stands at 54, indicating a neutral stance. Other oscillators like the Stochastic, commodity channel index (CCI), and average directional index (ADX) also show neutral values. However, the momentum and MACD level suggest a buy signal, highlighting potential bullish sentiments in the near term.
The moving averages (MAs) present a mixed outlook. Short-term averages such as the ten-day exponential moving average (EMA) and ten-day simple moving average (SMA) indicate a sell signal, while the medium to long-term averages like the EMA (20, 30, 50, 100, 200) and SMA (20, 30, 50, 100, 200) signal bullish sentiment. This divergence underscores the current market’s indecision, with short-term caution contrasting with longer-term optimism.
Bull Verdict:
If bitcoin can sustain above the key support level of $67,200 and break through the $69,500 resistance with increasing volume, it may signal a continuation of the bullish trend, potentially targeting new highs.
Bear Verdict:
Should bitcoin fail to maintain the $67,200 support and face continued selling pressure, it might indicate a bearish reversal, leading to further declines and testing lower support levels.