
As of May 27, 2024, bitcoin is trading at $68,457 with a market capitalization of $1.34 trillion. The leading crypto asset has experienced an intraday price range of $68,308 to $69,340 with a 24-hour trade volume of $10.74 billion.
Bitcoin
The short-term analysis based on BTC’s 1-hour chart reveals a slight downward trend following a failed attempt to maintain the $69,500 level. The support level is established at $68,136, with resistance at $69,500. Recent price action shows consolidation around the $68,500 to $69,000 range, indicating a potential stabilizing phase. Notably, volume spikes during price drops highlight strong selling pressure, while lower volumes on the upswings suggest weak buying interest.
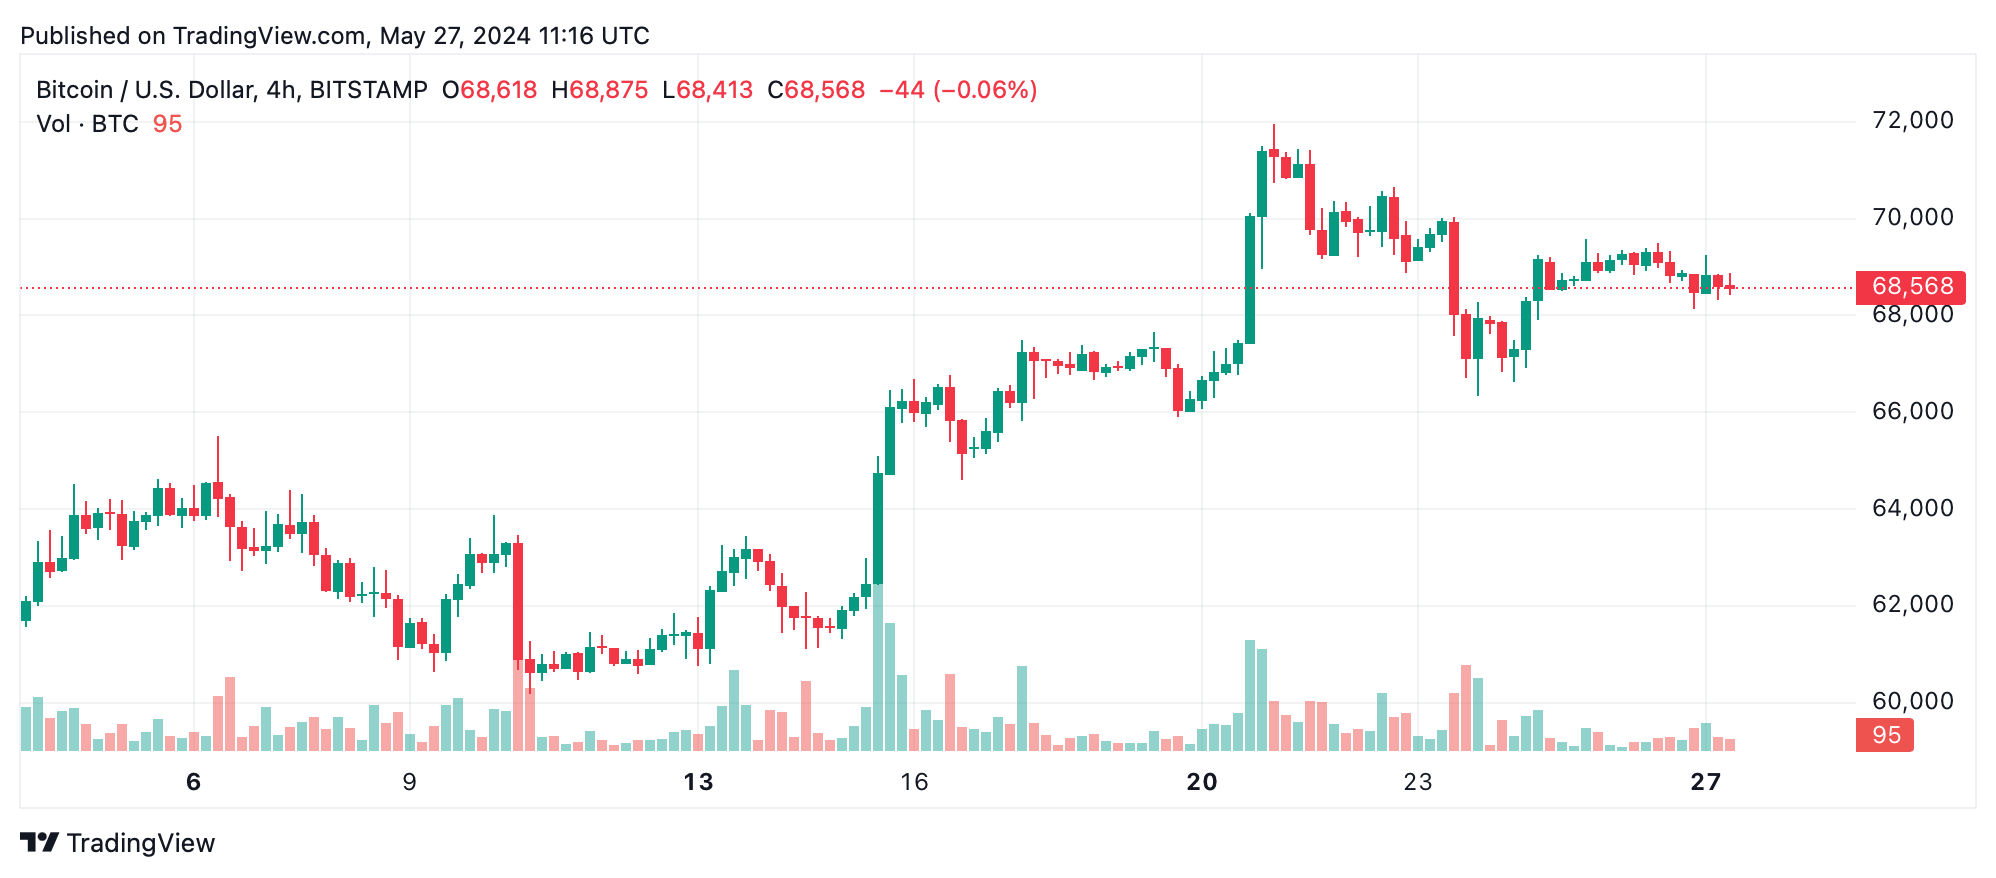
In the medium-term, the 4-hour chart exhibits a slightly bearish trend characterized by lower highs and lows. The support level is marked at $66,343, with resistance at $70,649. The price has struggled to break above $69,000, reinforcing this as a key resistance area. Increased volume during large price drops further underscores the dominance of selling activity in this timeframe.
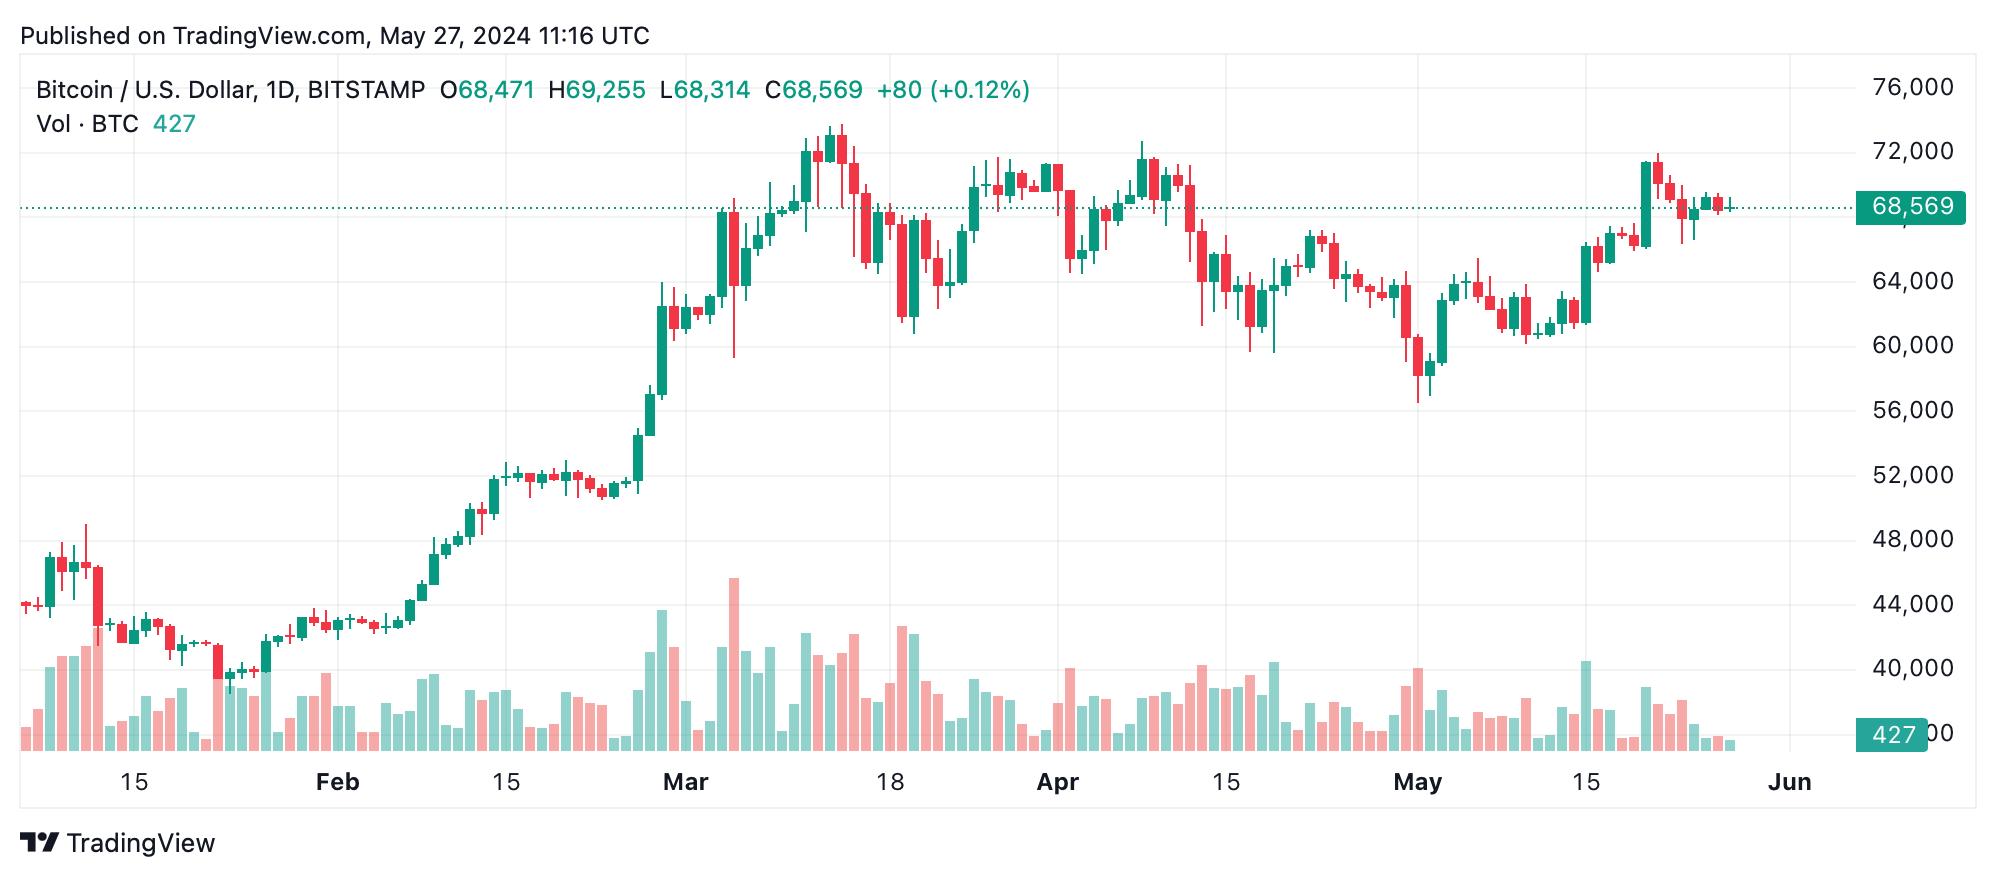
The long-term outlook from the daily chart shows bitcoin’s recovery from a low of $56,500, but it is currently facing resistance around $71,000. This significant resistance level at $71,958 is pivotal for bitcoin’s next upward movement. The uptrend’s momentum appears to be waning as the price consolidates below this resistance. High volume during the recent uptrend towards $71,958 indicates strong buying interest, yet recent volume spikes on the latest price dips point to growing selling pressure.
Oscillator readings provide mixed signals. The relative strength index (RSI) at 57 and the Stochastic at 71 both reflect a neutral stance, suggesting no immediate overbought or oversold conditions. Similarly, the commodity channel index (CCI) and the awesome oscillator also present neutral readings. However, the momentum indicator signals bearish sentiment with a value of 1411, while the moving average convergence divergence (MACD) level suggests positivity at 1438, indicating potential volatility and indecision in the market.
Moving averages (MAs) show a predominantly bullish signal. Short-term moving averages, including the 10-period exponential moving average (EMA) and the 20-period simple moving average (SMA), show bullish sentiment, reinforcing the potential for upward movement. Similarly, medium to long-term MAs, such as the 50-period and 200-period EMAs and SMAs, all indicate bullish actions, suggesting a positive outlook in the broader timeframes.
Bull Verdict:
Based on the predominance of bullish signals from the moving averages and the strong recovery seen in the long-term trend, bitcoin could see a continuation of its upward trajectory. The consolidation below key resistance levels may serve as a platform for a potential breakout, especially if buying interest strengthens as indicated by volume spikes during uptrends.
Bear Verdict:
The bearish trend observed in the short-term and medium-term charts, coupled with mixed signals from oscillators, suggests caution. The price struggling to break above significant resistance levels and the recent increase in selling pressure could lead to further downward movement if bearish momentum continues. Traders should closely monitor these levels and be prepared for potential declines.