
Bitcoin is currently priced at $67,350, with a market capitalization of $1.32 trillion and a trading volume of $42.36 billion. The cryptocurrency’s price has fluctuated within the range of $66,665 to $70,028 over the last 24 hours.
Bitcoin
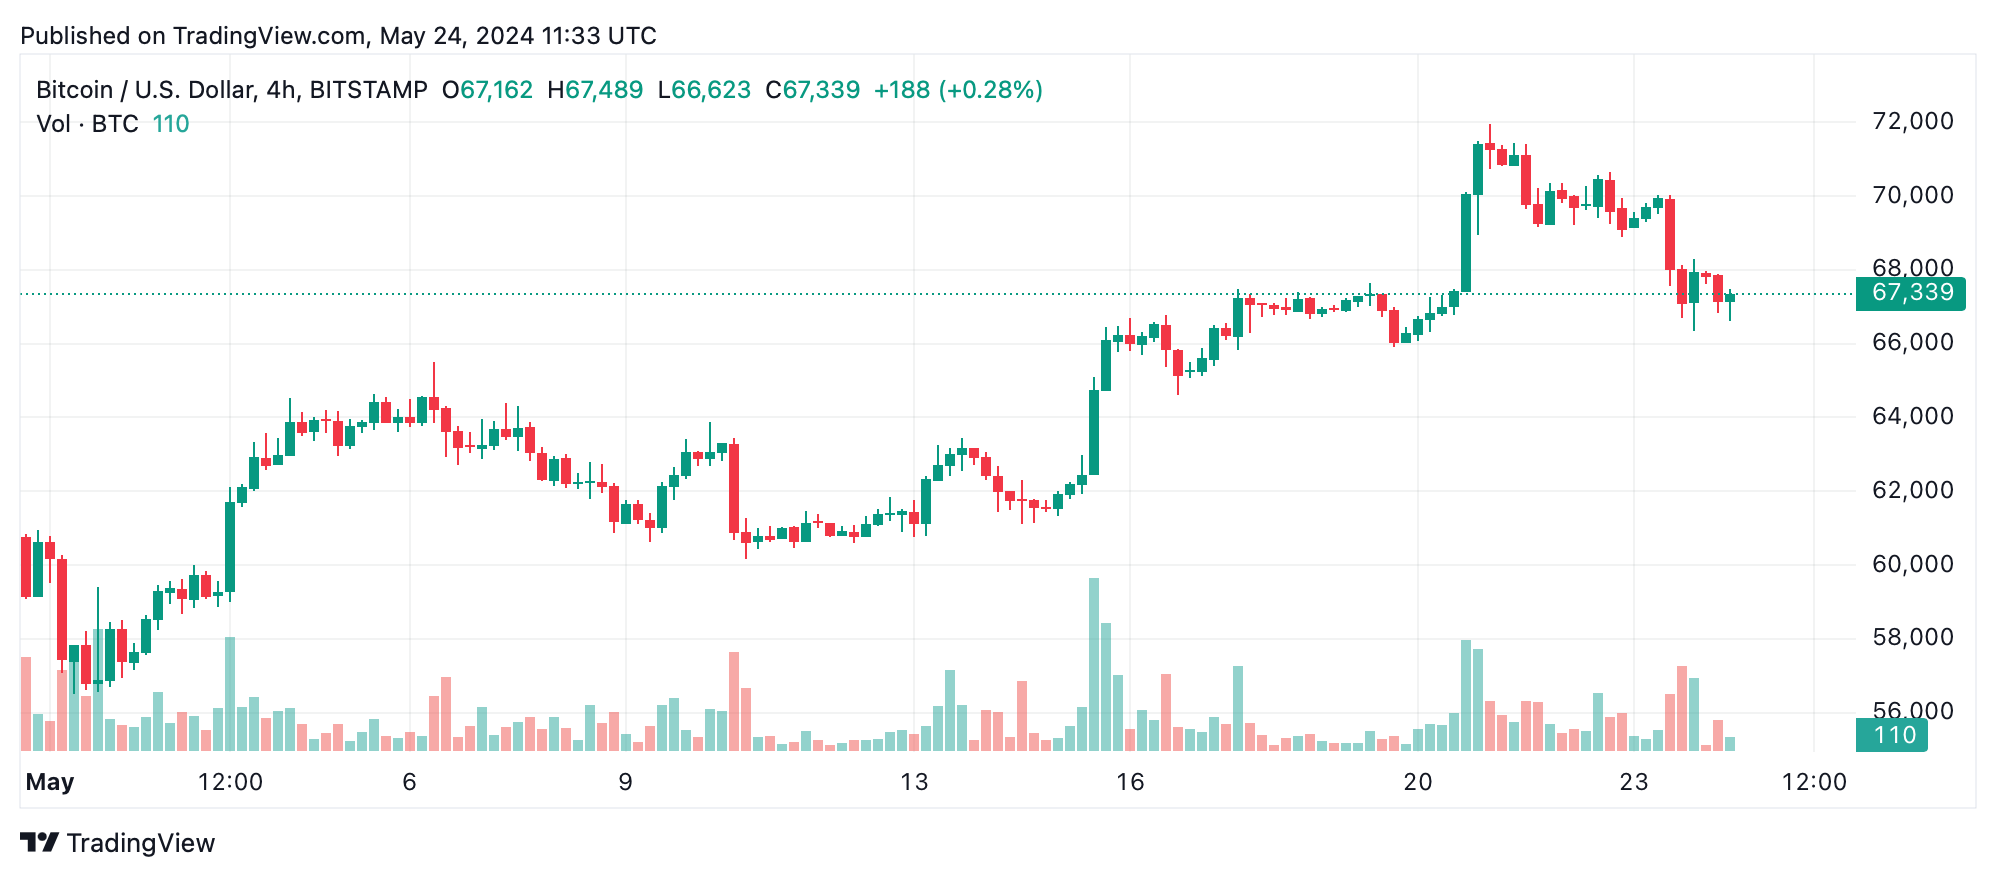
Recent trends in the daily chart reveal bitcoin ($BTC) reaching a peak of $71,958 before retreating to its current price range. The volume has shown significant drawdowns, indicating selling pressure. Candlestick patterns, such as bearish engulfing, suggest potential reversal points, particularly around the recent peak. The 4-hour chart mirrors the daily trend, showing the same short-term high at $71,958 followed by a sharp decline.
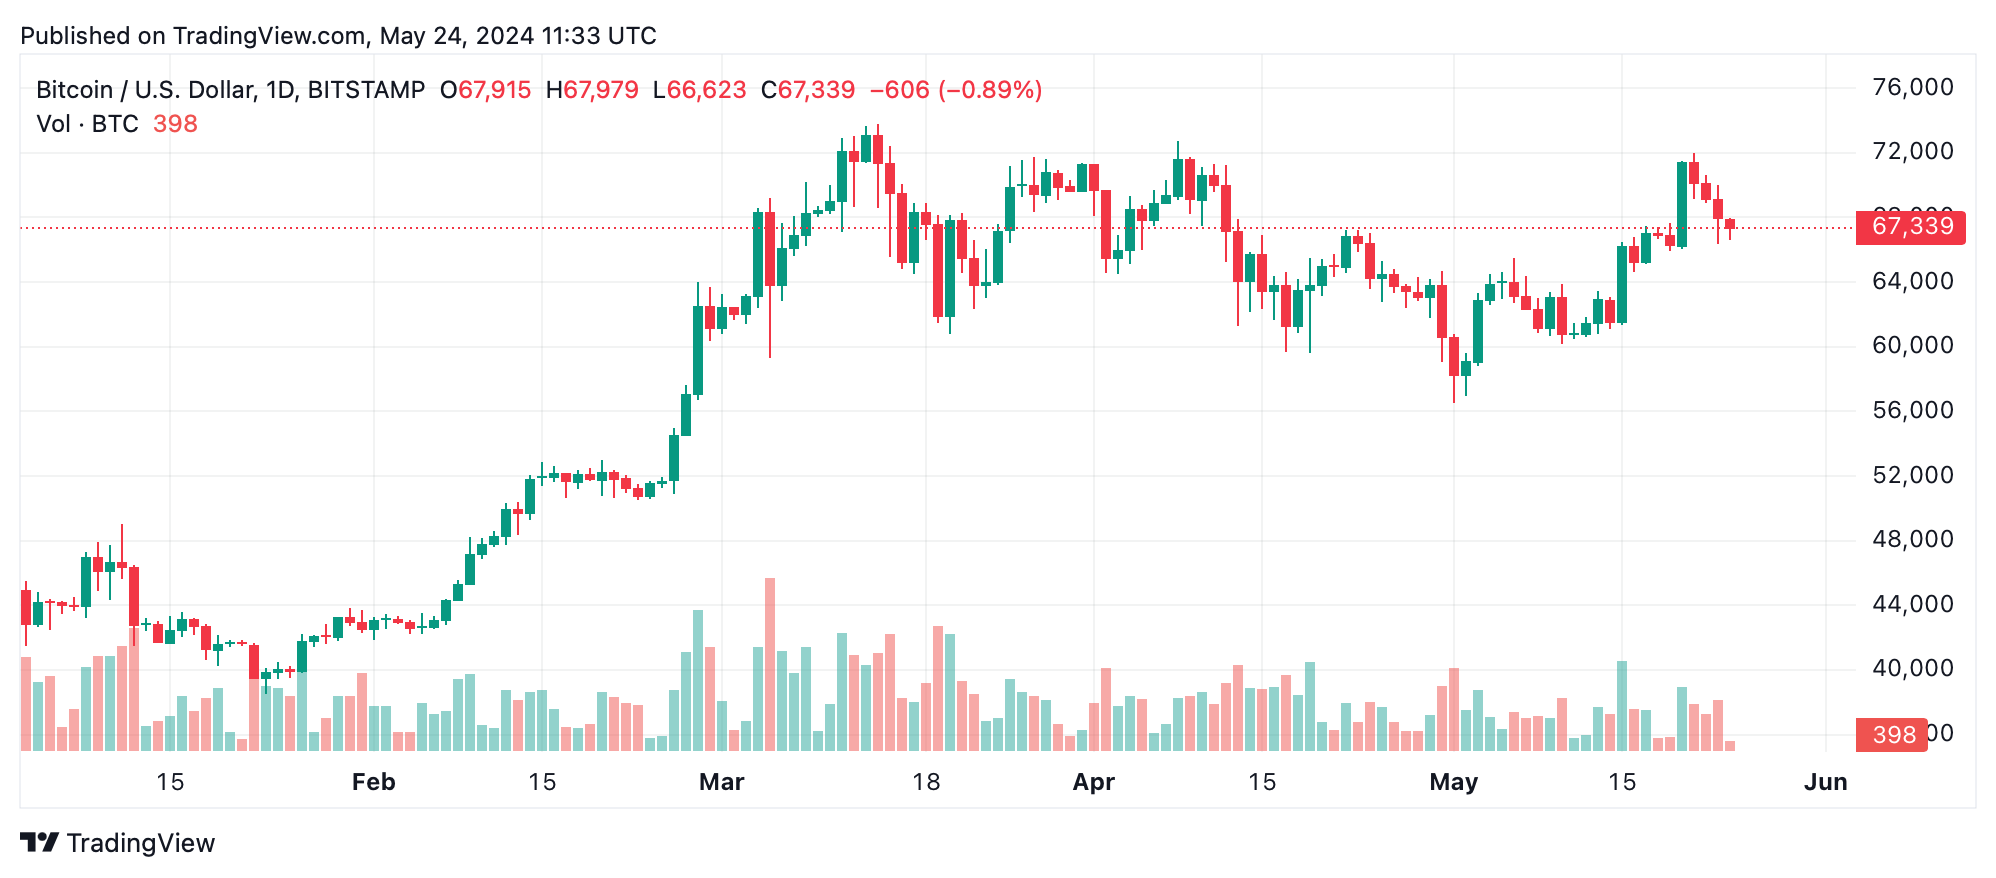
Currently, bitcoin is consolidating around $67,000 with lower highs and lower lows, indicating some bearish sentiment. High volume during the decline from $71,958 to $67,000 reinforces this bearish outlook. A descending trendline forms from the peak, suggesting ongoing selling pressure. A potential bullish reversal might occur if the price breaks above recent lower highs.
The hourly chart shows immediate resistance around $70,024, where the recent decline began. Bitcoin’s price has stabilized around $67,000 after testing lows near $66,343. The volume analysis shows a spike in sell volume around $70,024, followed by a gradual decrease. The current bearish continuation pattern suggests an ongoing downtrend with intermittent consolidation, with support and resistance levels at $66,343 and $70,024, respectively.
Various oscillators provide a mixed signal for bitcoin. The relative strength index (RSI) is at 55, indicating a neutral stance. The Stochastic, commodity channel index (CCI), and average directional index (ADX) all point to a neutral action. However, the momentum and moving average convergence divergence (MACD) level oscillators indicates optimistic sentiment, suggesting some underlying bullish momentum despite the prevailing bearish sentiment.
Moving averages (MAs) offer a predominantly bullish outlook. The exponential moving averages (EMA) for 10, 20, 30, 50, 100, and 200 periods all suggest bullish sentiment, indicating upward momentum over various timeframes. However, the 10-period simple moving average (SMA) signals bearish action, while other SMAs (20, 30, 50, 100, 200) align with the EMAs, indicating a broader bullish trend.
Bull Verdict:
Given the overall bullish signals from the moving averages and the optimistic signal from the momentum and MACD level oscillators, bitcoin could see a potential upward move if it breaks above key resistance levels. Traders should look for strong volume confirming the breakout to take long positions.
Bear Verdict:
Despite some bullish indicators, the presence of significant selling pressure and bearish candlestick patterns cannot be ignored. If bitcoin fails to break above resistance levels and continues to show lower highs and lower lows, the bearish trend may persist, warranting caution for potential downside risk.