
Bitcoin (BTC) has seen a remarkable recovery, breaking the $71,000 barrier for the first time in over a month. This upward movement is largely attributed to a surge in spot buying and interest in spot Bitcoin ETFs. As investors pour money into these newly approved funds, the market exhibits a strong bullish trend that could indicate the start of a more sustained bull market.
BTC/USD 24-hour price chart (source: CoinMarketCap)
However, despite the bullish rally, resistance at the intra-day high of $71,946 was stiff to breach. Despite that, at press time, BTC was bullish, trading at $71,061, a 5.89% surge from the intra-day low of $66,319. Concurrently, the positive sentiment was evidenced in the market cap and trading volume that soared by 5.86% and 135%, respectively, to $1,400,852,056,633 and $51,363,824,061.
Factors Driving Bitcoin’s Price Increase
Several key factors have contributed to Bitcoin’s recent price rally. First, the U.S. Bureau of Labor Statistics reported a lower-than-expected inflation rate for April. This data suggests that the Federal Reserve might be more inclined to cut interest rates, currently at a 23-year high, creating a more favorable environment for investment in assets like Bitcoin.
Additionally, approximately $950 million has been pumped into Bitcoin spot ETFs over the past week, underscoring the heightened investor interest and market liquidity.
On-chain analytics reveal a bullish scenario for Bitcoin. According to data from LookIntoBitcoin, indicators such as the Bitcoin MVRV Z score and the Puell Multiple are currently at levels that traditionally suggest a bull market is in its early stages.
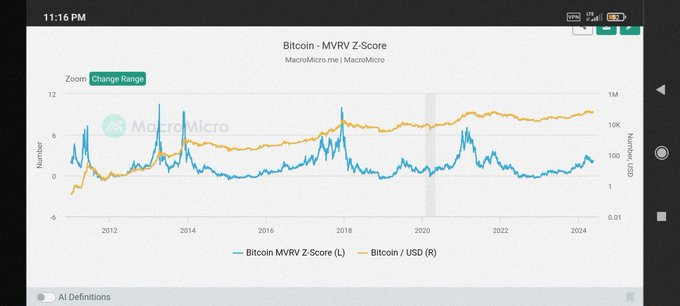
BTC MVRV Z Score
Furthermore, the Bitcoin market dominance remains high at over 56%, indicating that Bitcoin is still the preferred choice over altcoins among investors.
Moreover, exchange BTC reserves have hit a seven-year low, as reported by CryptoQuant, with only 1,918,417 BTC available on major trading platforms. This scarcity of Bitcoin, combined with the recent halving event, which reduced the new supply from miners, supports a bullish outlook for the cryptocurrency’s price.
Concurrently, the recent increased odds of Spot Ethereum ETF approval, which is attributed to the BTC bullish momentum, have moved from 25% to 75%. If these funds are to be approved, a bullish ground would be set for a prolonged BTC rally.
BTC/USD Technical Analysis
The technical analysis of Bitcoin’s trading patterns also supports an optimistic future. The cryptocurrency is currently trading just below the $71,000 mark, with key resistance near $68,000 now surpassed.
Technical indicators like the 20-day Exponential Moving Average (EMA) and the Relative Strength Index (RSI) suggest that an upward breakout is likely. If this trend continues, Bitcoin could reach new all-time highs, approaching the forecasted target of $73,000.
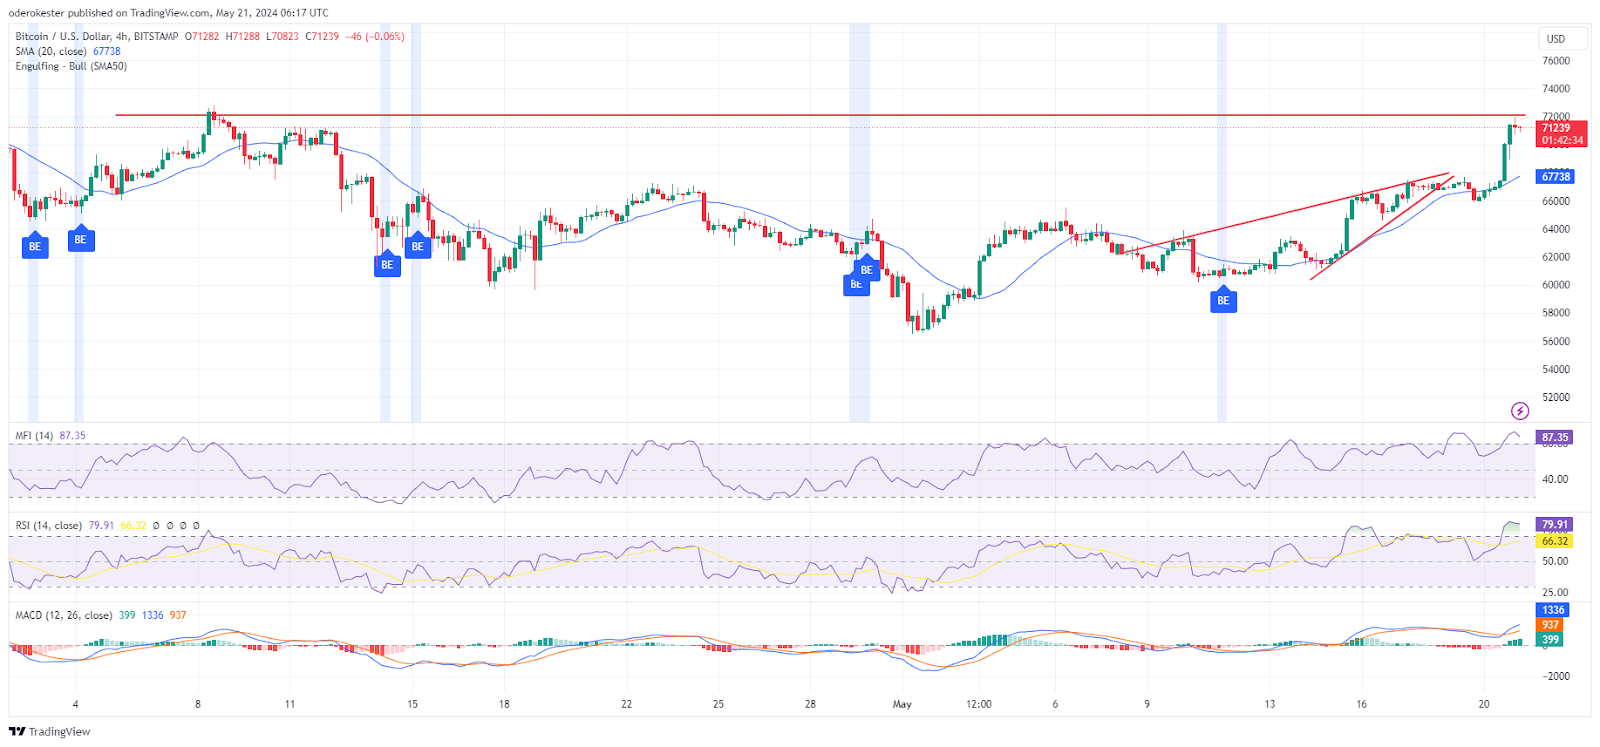
BTC/USD 4-hour price chart (source: TradingView)
However, with the RSI overbought on the 4-hour price chart, bullish momentum may be waning. The Money Flow Index (MFI) rating of 87.38 also suggests that bullish momentum was strong but may have exhausted its rally. Nevertheless, since the Moving Average Convergence Divergence (MACD) is still above its signal line and the histogram is developing higher bars, the bulls have the upper hand, with a potential breakout looming.
Disclaimer: The information presented in this article is for informational and educational purposes only. The article does not constitute financial advice or advice of any kind. Coin Edition is not responsible for any losses incurred as a result of the utilization of content, products, or services mentioned. Readers are advised to exercise caution before taking any action related to the company.