
As of May 17, 2024, bitcoin’s price stands at $66,303 with a market capitalization of $1.30 trillion and a 24-hour trading volume of $28.43 billion. Technical indicators from multiple time frames suggest a potential continuation of the bullish trend, albeit amidst notable market volatility. The convergence of moving averages and oscillators signals a strong upward momentum.
Bitcoin
Bitcoin’s hourly chart shows a recent recovery from $64,598 to $66,766, with significant volume spikes during price movements, indicating strong market participation. Key support is found between $65,500 and $65,700, with resistance around $66,700 to $67,000. This consolidation pattern highlights a potential for further gains if the resistance is breached.
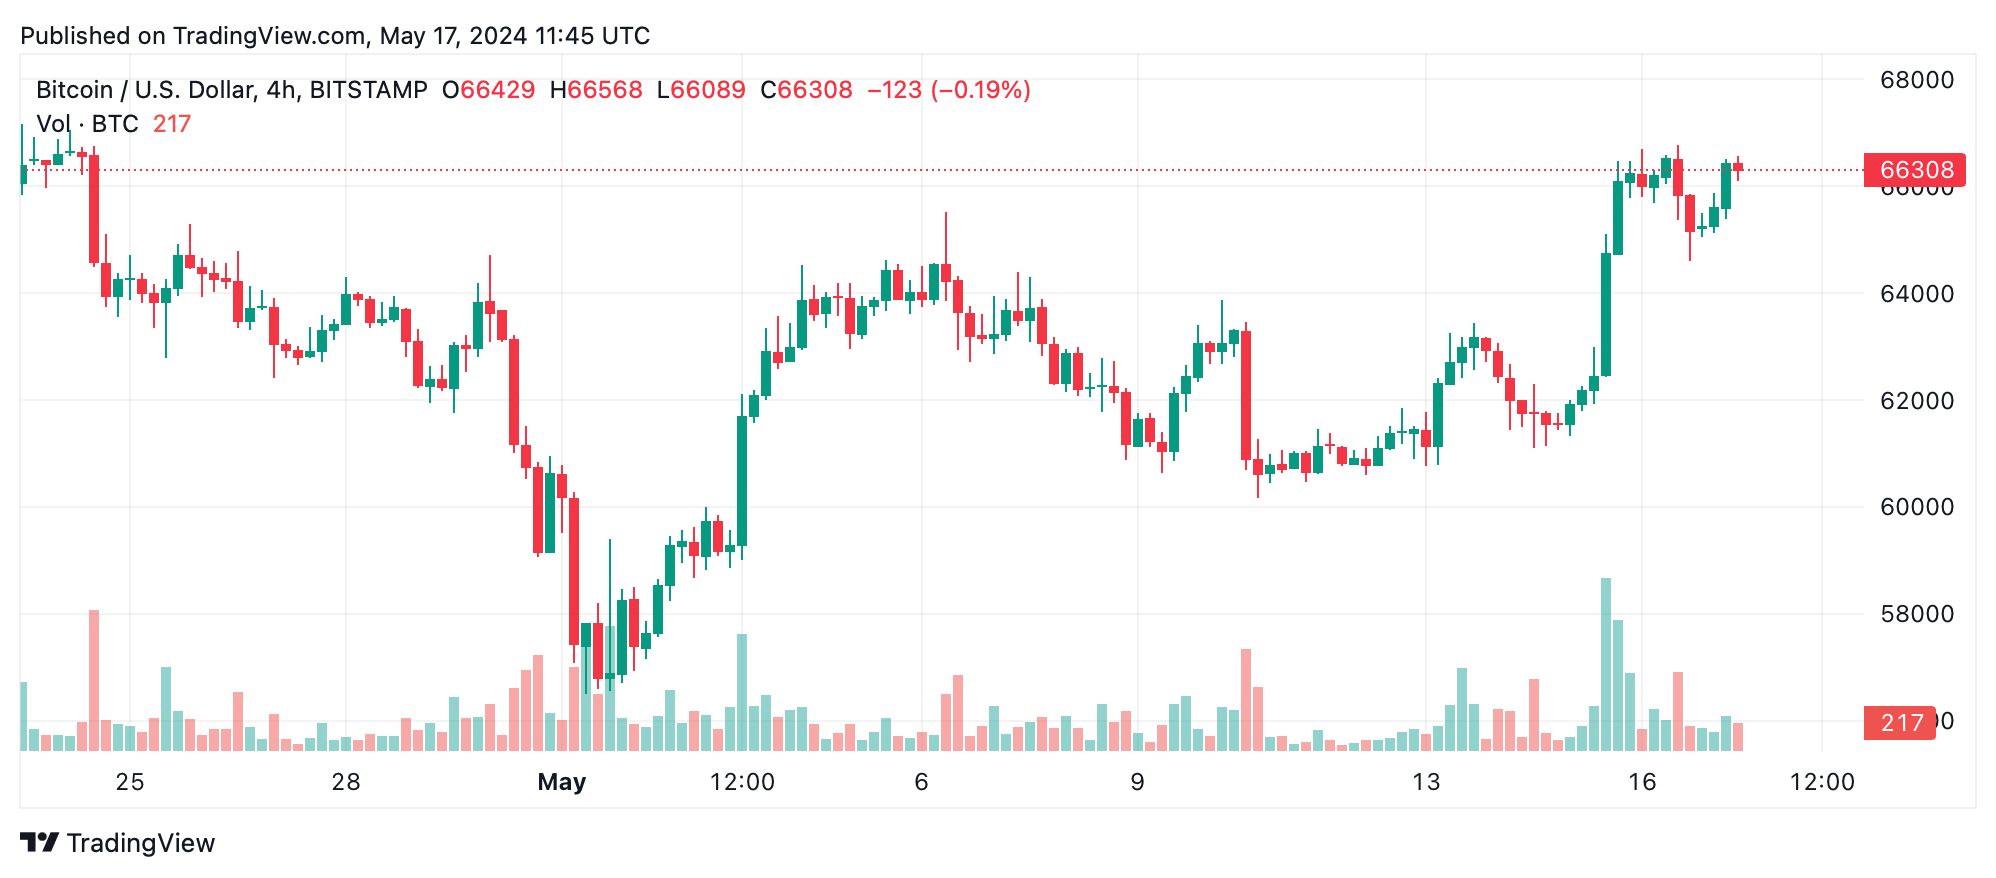
The four-hour chart provides a broader perspective, revealing a decline to approximately $60,600 followed by a robust recovery to $66,766. The volume spikes align with major price movements, suggesting strong market activity. Here, the support level around $64,500 to $65,000 is crucial, while resistance near $67,000 remains a key target for bulls.
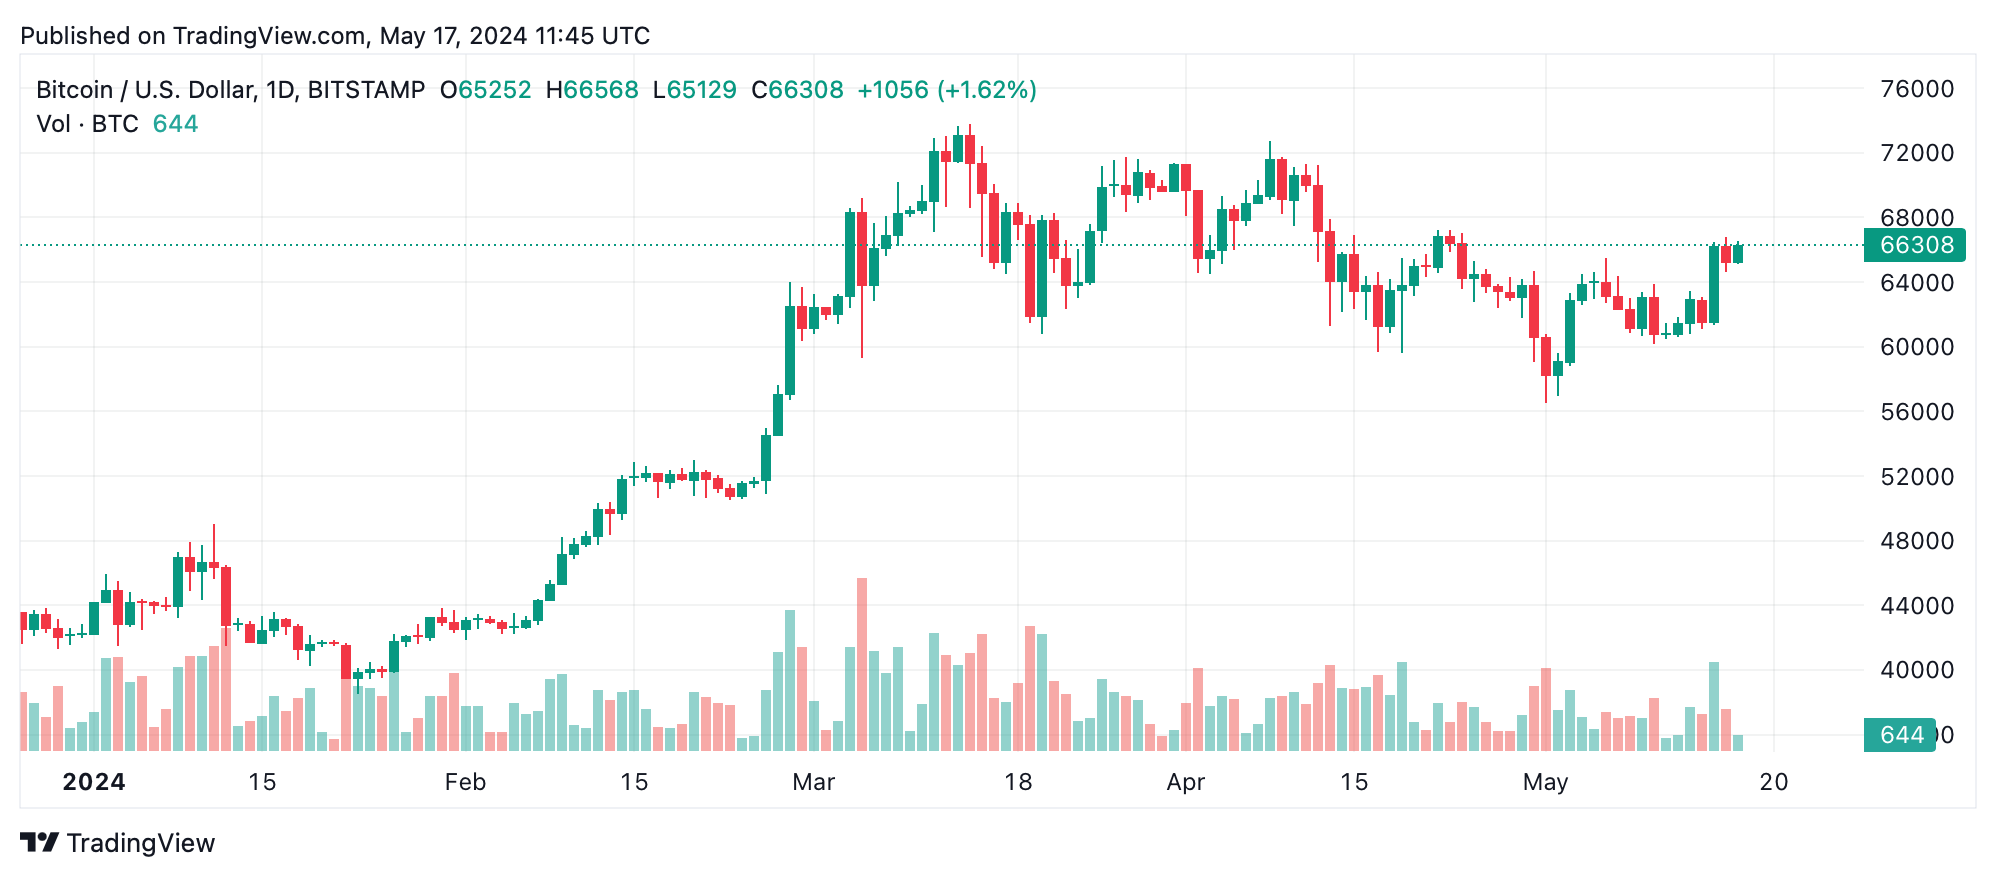
On the daily chart, bitcoin’s price experienced a sharp decline to $56,500 on April 30, before a strong recovery to a recent high of $67,241. This volatility underscores the market’s susceptibility to significant fluctuations. The support zone between $62,000 and $63,000 is vital, while the resistance range of $66,500 to $67,000 could dictate future price action.
Oscillators present a mixed yet cautiously optimistic outlook. The relative strength index (RSI) at 57 and the Stochastic at 90 both remain neutral, indicating neither overbought nor oversold conditions. However, the commodity channel index (CCI) at 158 suggests a bearish signal, while the awesome oscillator and moving average convergence divergence (MACD) levels both indicate a buy, reflecting underlying bullish momentum.
Moving averages (MAs) across various time frames predominantly signal a buy. The exponential (EMA) and simple moving averages (SMA) from 10 to 200 periods all indicate bullish trends. For instance, the 10-period EMA at $63,770 and the 200-period SMA at $51,835 underscore the current price’s strength above these averages, supporting the bullish outlook.
Bull Verdict:
Bitcoin’s current technical indicators and market conditions point to a bullish trend continuation, with strong support and upward momentum suggesting potential for further price increases.
Bear Verdict:
Despite bullish signals, market volatility and mixed oscillator readings could indicate a possible retracement if resistance levels hold, warranting caution for bearish reversals.