
As of May 13, 2024, bitcoin exhibits mixed signals across various time frames and technical indicators, presenting a complex landscape for traders. The leading crypto asset’s price currently stands at $62,792, reflecting a slight increase within the 24-hour range from $60,776 to $63,156. Despite a recent 2% uplift, bitcoin remains down by 3.6% over the week, showcasing the volatility and uncertainty inherent in the current market.
Bitcoin
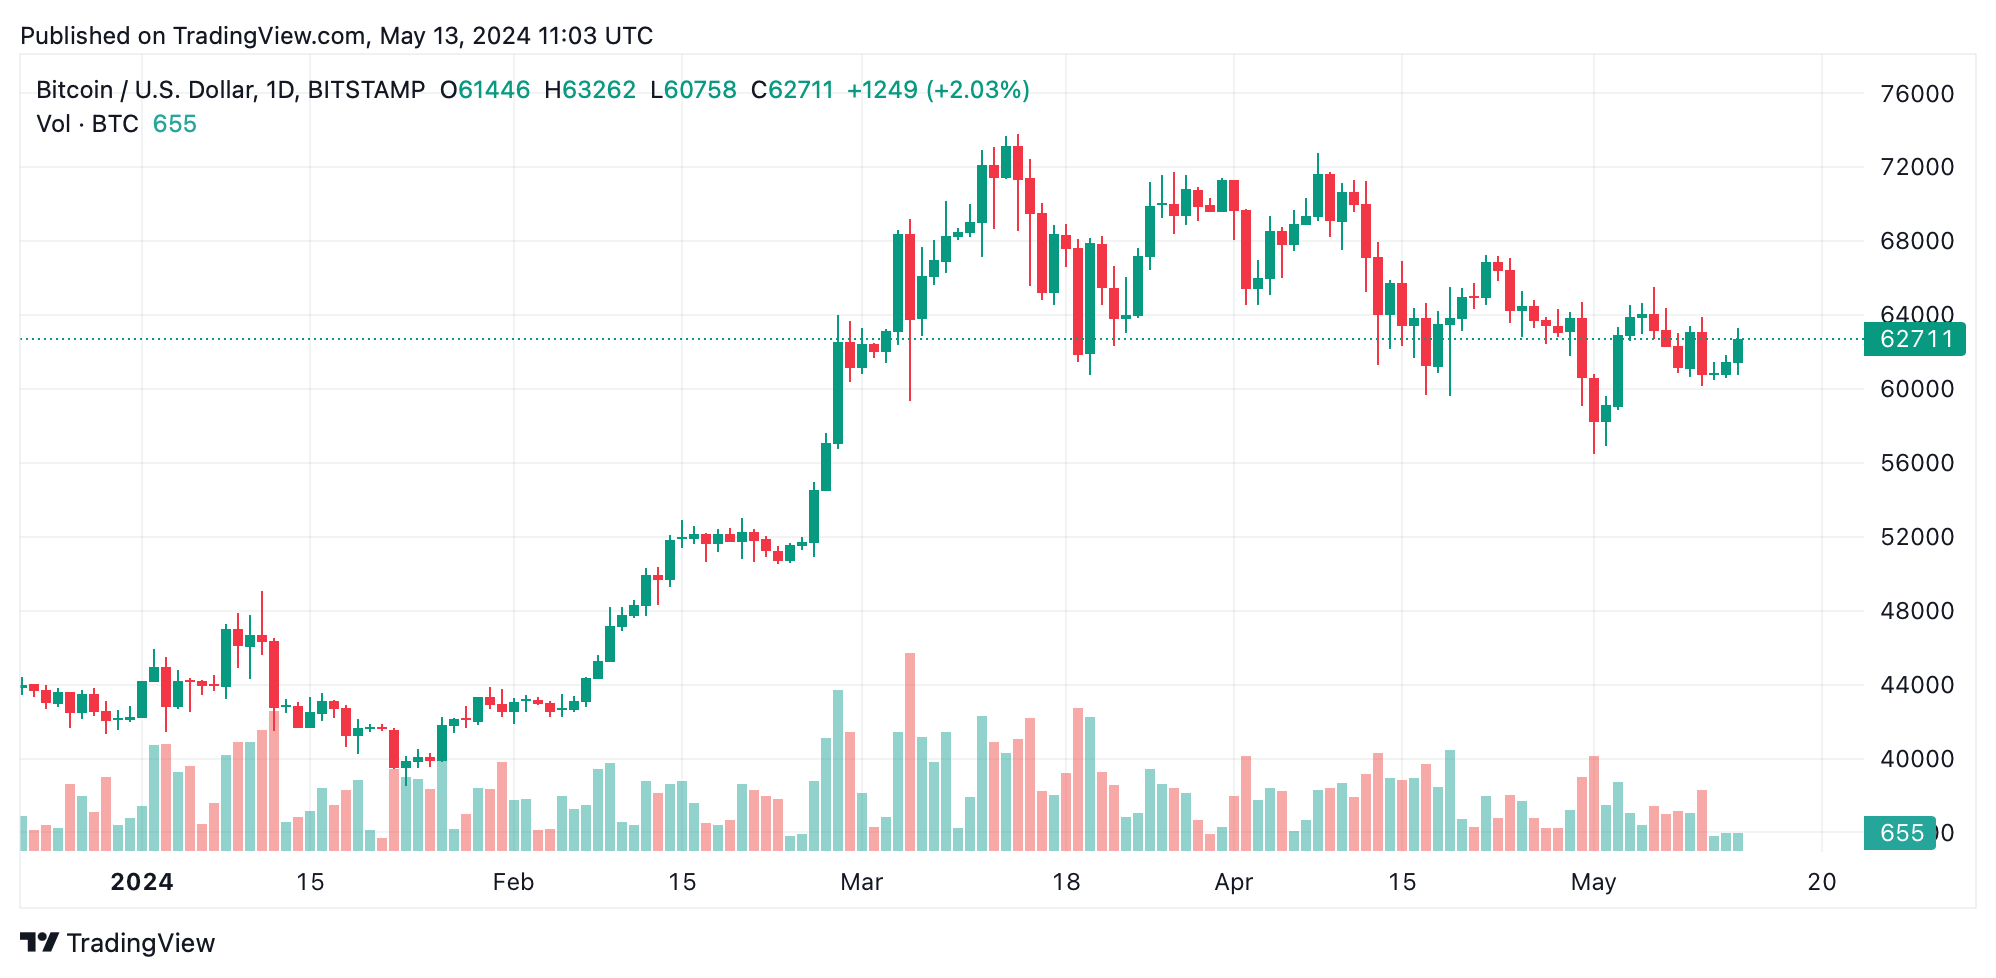
The BTC/USD daily chart underscores a phase of consolidation with a bearish slant. After peaking near $71,287 on April 10, bitcoin’s price corrected to a potential bottom around $56,500. The latest rebound seems to lack volume-backed conviction, suggesting that the increase might not have strong support. This scenario indicates potential vulnerability, where the lack of buying pressure could lead to further dips unless more buyers step in.
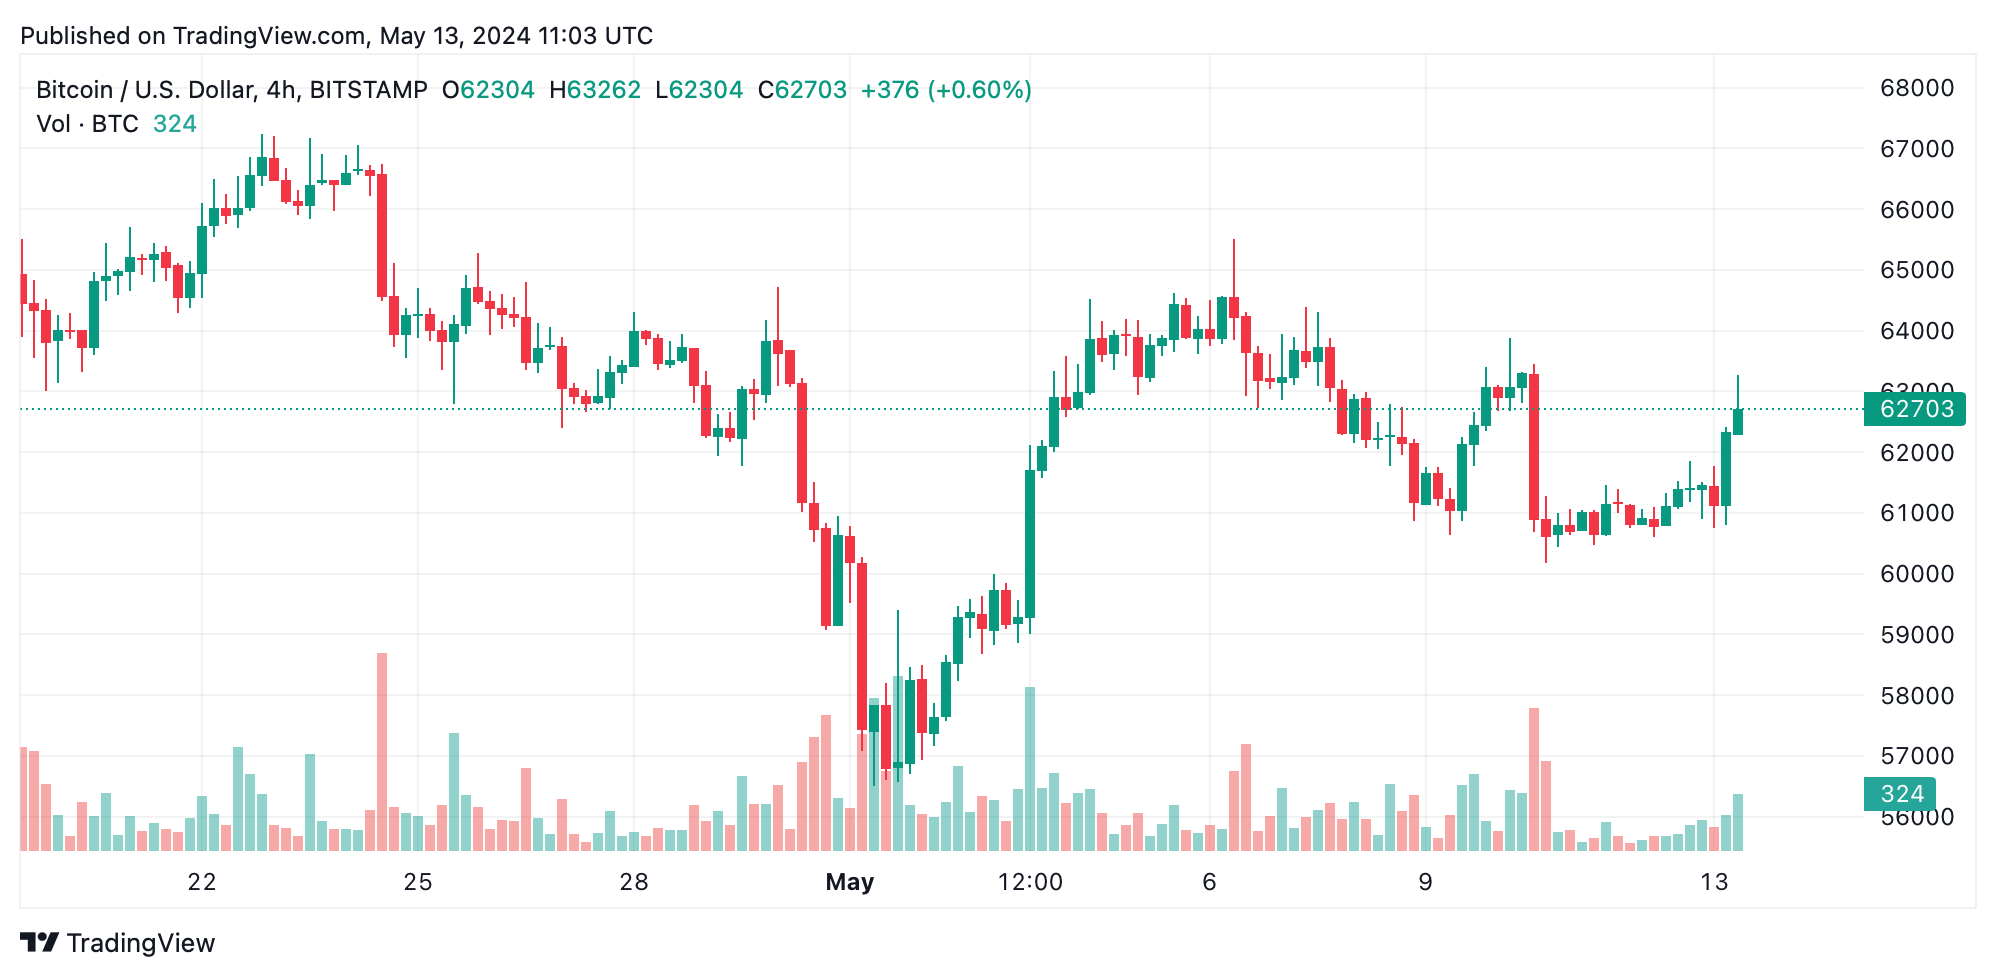
The 4-hour chart offers a glimpse into bitcoin’s short-term recovery attempts. Notably, the price has rebounded from a low of $60,176, testing the resistance near $63,876. The recent activity shows attempts to build support around $62,000. Enhanced volume during bullish rises points to a growing buying interest, which may underpin further upward movements if sustained.
On the 1-hour chart, bitcoin’s bullish momentum is more pronounced, with price movements from $60,600 to over $63,200. The increasing volume accompanying these upswings suggests strong buying interest that could drive continued price appreciation in the near term. The current readings from key oscillators like the relative strength index (RSI) at 49 and the Stochastic at 58 give a neutral outlook, indicating no immediate overbought or oversold conditions.
However, the negative readings on the awesome oscillator and momentum indicators suggest caution, as they hint at possible downward pressure or weakening trends. The moving averages (MAs) further present a diversified perspective. Short-term exponential (EMAs) and simple moving averages (10-day, 20-day SMAs) suggest bullish sentiment, likely influenced by recent price recoveries. In contrast, the longer-term averages (50-day, 30-day EMAs, and SMAs) indicate bearish behavior, reflective of the broader negative sentiment observed in the daily chart trends.
Bull Verdict:
Given the positive signals on the shorter-term charts, such as the 1-hour and 4-hour frames, coupled with favorable moving averages and increasing volume, there is a solid foundation for potential price appreciation in the near term. If bitcoin can sustain support levels above $62,000 and break through the $63,876 resistance, it could trigger further bullish momentum.
Bear Verdict:
Despite the recent uptick in buying interest on shorter time frames, the prevailing bearish trend on the daily chart and the mixed signals from oscillators and longer-term moving averages caution against undue optimism. The lack of volume support on key bullish days and the potential for a failed rebound suggest that bitcoin could resume its broader downtrend.