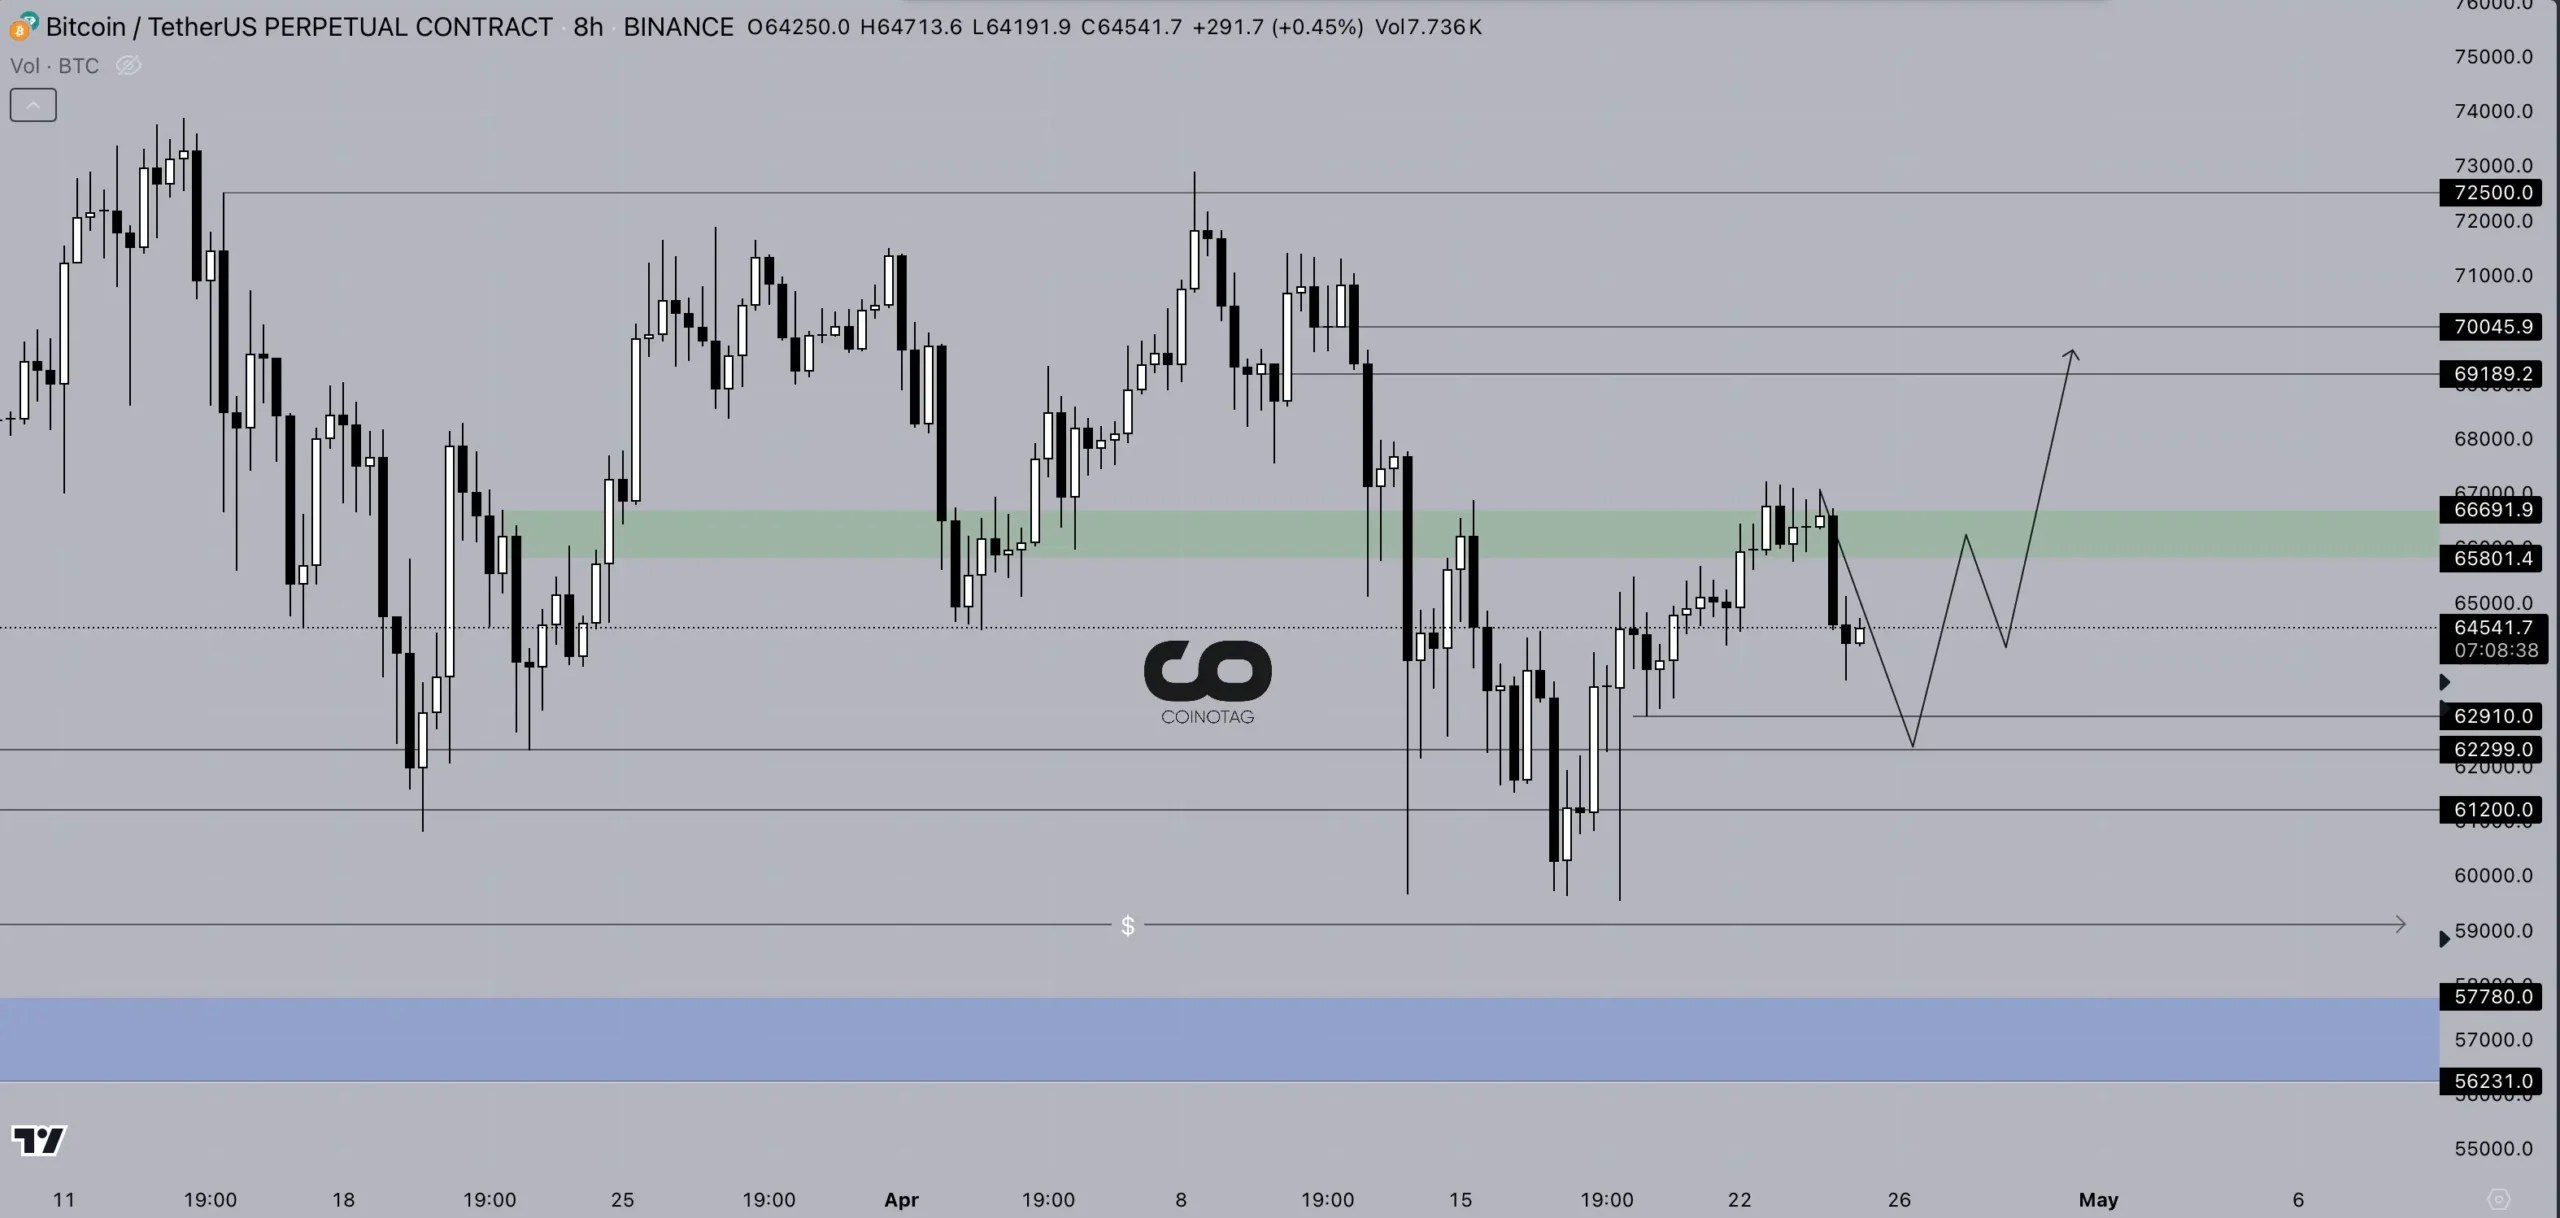
The ongoing analysis of Bitcoin’s 8-hour chart shows a consistent bearish trend. The cryptocurrency has been unable to break above the indicated resistance zone, keeping the downward pressure intact. Should Bitcoin continue to trade below these critical levels, the likelihood of further declines remains high.
Immediate Challenges and Resistance Levels
Bitcoin’s immediate technical challenge is to overcome the resistance range of $66,700 to $65,800. Analysts emphasize the importance of closing above this range to mitigate the current bearish bias and potentially initiate a bullish reversal. Failure to achieve a close above this green zone as noted in the analysis could increase the selling pressure.
Support Levels and Potential Downside Risks
Key support levels play a crucial role in Bitcoin’s current market stance. The $62,300 support level is particularly pivotal. A breakdown below this point could trigger a decline towards the $61,200 level, marking a significant bearish continuation. However, if Bitcoin encounters strong buying interest at this support, there might be a chance for recovery.
Long-Term Implications of Current Trends
If Bitcoin’s price fails to hold above $61,200 and closes below this level on a daily basis, it could potentially signal a continuation of the downward trend. Such a move would underscore the bearish sentiment in the market and could set new lower price targets for the cryptocurrency.
Conclusion
The current technical analysis of Bitcoin paints a cautious picture for its immediate future. While there are potential recovery points, the prevailing market conditions and resistance levels must be closely monitored. Investors and traders should pay attention to these key technical levels to make informed decisions in the volatile cryptocurrency market.

 en.coinotag.com