Bitcoin’s market value has experienced significant shifts following the recent halving event at block height 840,000, which saw onchain fees soar beyond $240 per transaction. This pivotal change coincides with a notable fluctuation in price, demonstrating a complex interplay of supply and demand forces at work. Currently, bitcoin is trading at $64,488, down 4.5% this week, with an intraday range stretching from $63,161 to $64,968.
Bitcoin Price Shows Bullish Signals Following the Halving
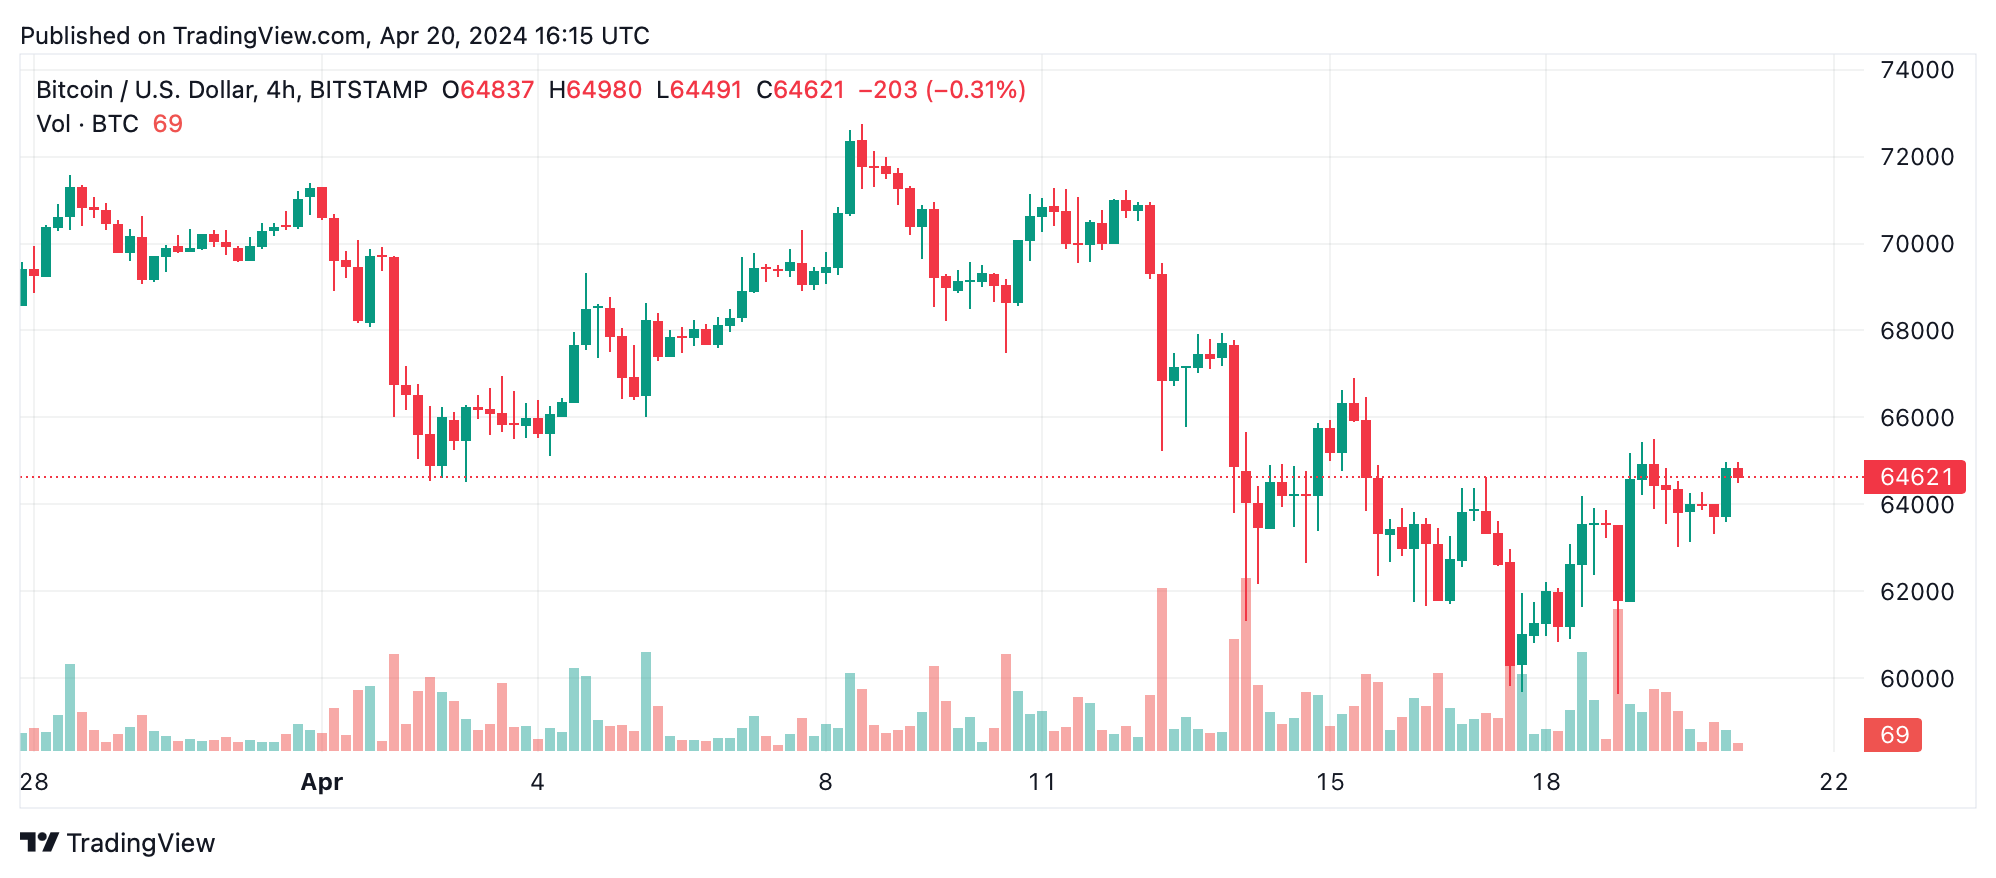
The 1-hour and 4-hour charts depict a market teeming with instability and rising buying interest. Specifically, bitcoin’s (BTC) 1-hour chart shows a significant price spread from $61,885 to $65,506, ending recently with a vigorous uptick that signals increasing purchase activities. On the other hand, the 4-hour view supports a bullish stance with ascending lows and a fresh uptrend, pointing to strong buying interest that may continue to propel prices higher, though traders should watch for potential retracements.
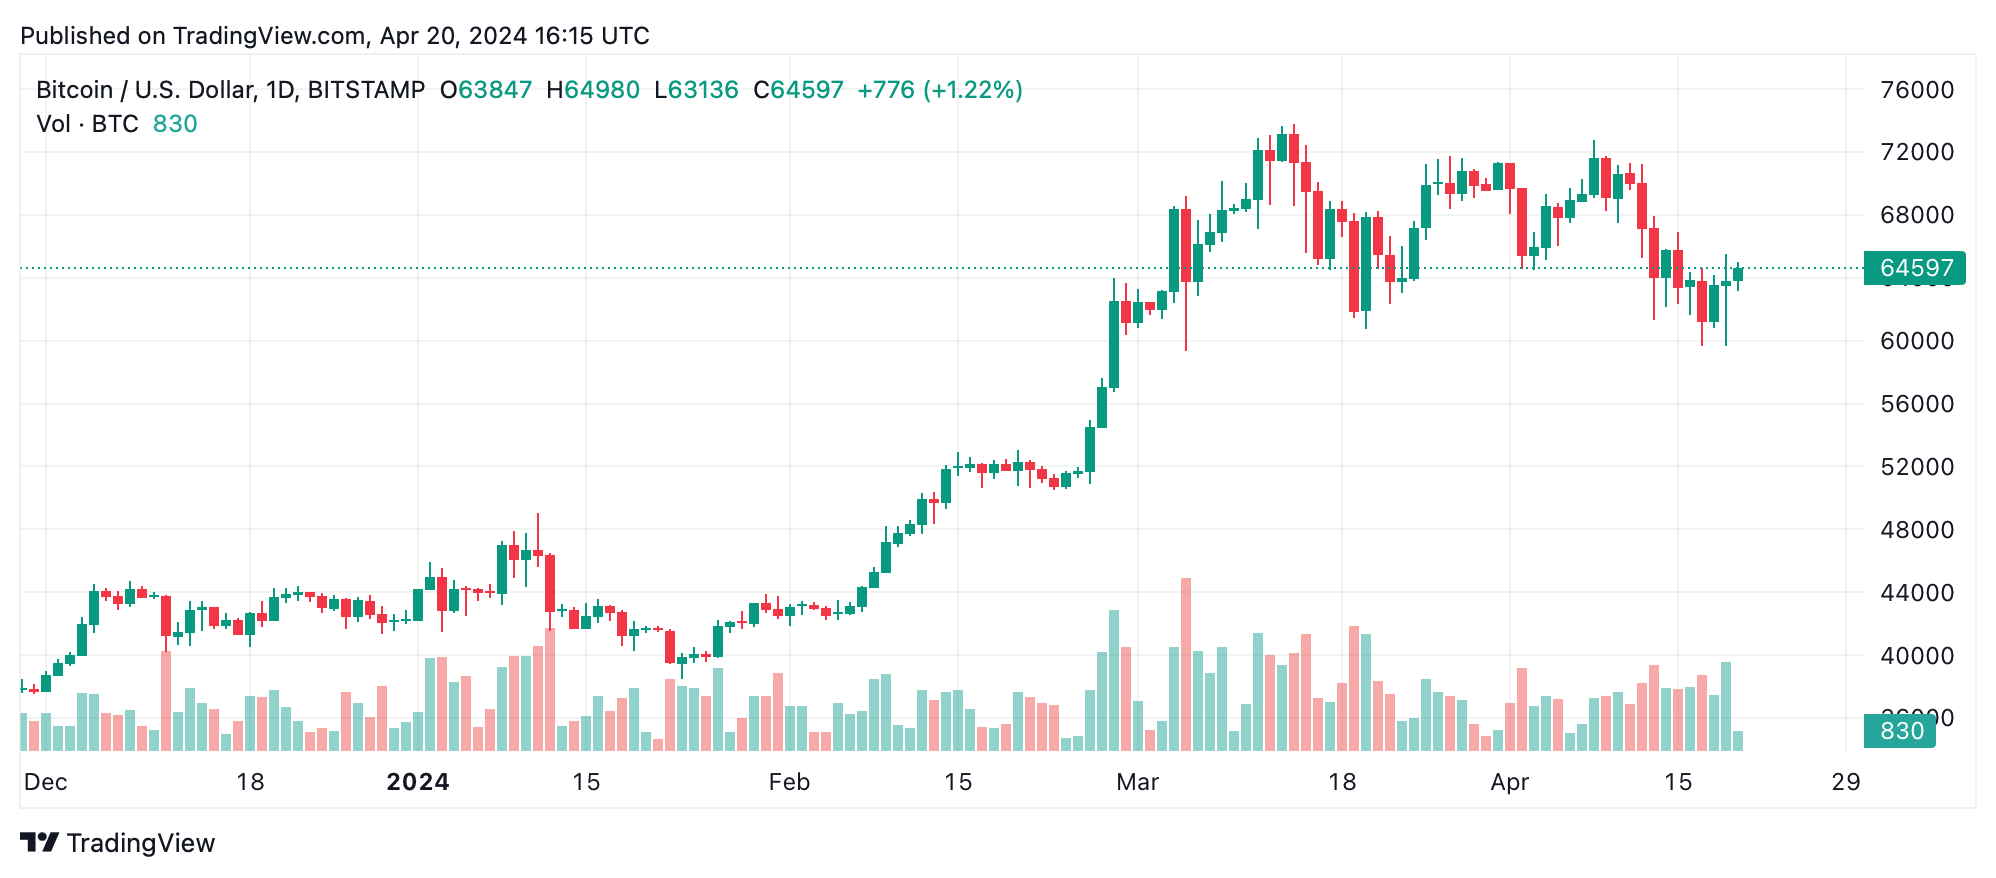
A review of the daily chart reveals a notable rebound from a recent low of $59,629, with current trends marked in green, indicating a bullish projection for the long term. Astute crypto traders might find opportunities if the price revisits and sustains the $59,629 level as support. However, they should be ready to strategize exits around the $72,756 threshold if signs of price resistance appear, suggesting a possible decline.
Market oscillators mostly indicate a neutral stance, with the relative strength index (RSI) at 47, and other metrics like the Stochastic and commodity channel index (CCI) mirroring this equilibrium. This neutrality in oscillators recommends traders leverage a cautious wait-and-see tactic. Moving averages (MAs) deliver a divided outlook, with shorter durations (EMA and SMA for 10 and 50 days) hinting at bullish prospects, whereas longer periods (20 and 30 days) imply selling pressures, highlighting the market’s uncertainty post-halving. Presently, BTC bulls are attempting to break the $65,000 range and hold it.
Bull Verdict:
Given the resilience of Bitcoin prices post-halving and the strong buying signals evident on both the 1-hour and 4-hour charts, there is a credible case for optimism. If the market maintains support at $59,629 and continues to exhibit bullish behavior, we could foresee an upward trajectory toward previous highs.
Bear Verdict:
Despite the current bullish indicators, the substantial rise in transaction fees following the halving poses significant concerns. Coupled with mixed signals from moving averages and a general trend of neutrality from oscillators, there is a substantial risk of a market downturn. If Bitcoin fails to hold key support levels and faces resistance near its recent high, this could trigger a bearish reversal, potentially leading to a downward correction in prices.