
As of April 15, 2024, bitcoin presents a mixed landscape of consolidation and subtle recovery hints, reflecting a crucial moment for potential bullish or bearish trends.
Bitcoin
Despite the current market indecisiveness indicated by the 1-hour chart, the 4-hour and daily charts suggest underlying movements that could influence future price actions. The 1-hour chart displays a consolidation phase with BTC prices oscillating between $62,773 and $66,797, creating a zone of uncertainty for traders. The appearance of a recent significant upswing hints at potential bullish momentum, yet the subsequent mixed patterns signal a cautious market sentiment.
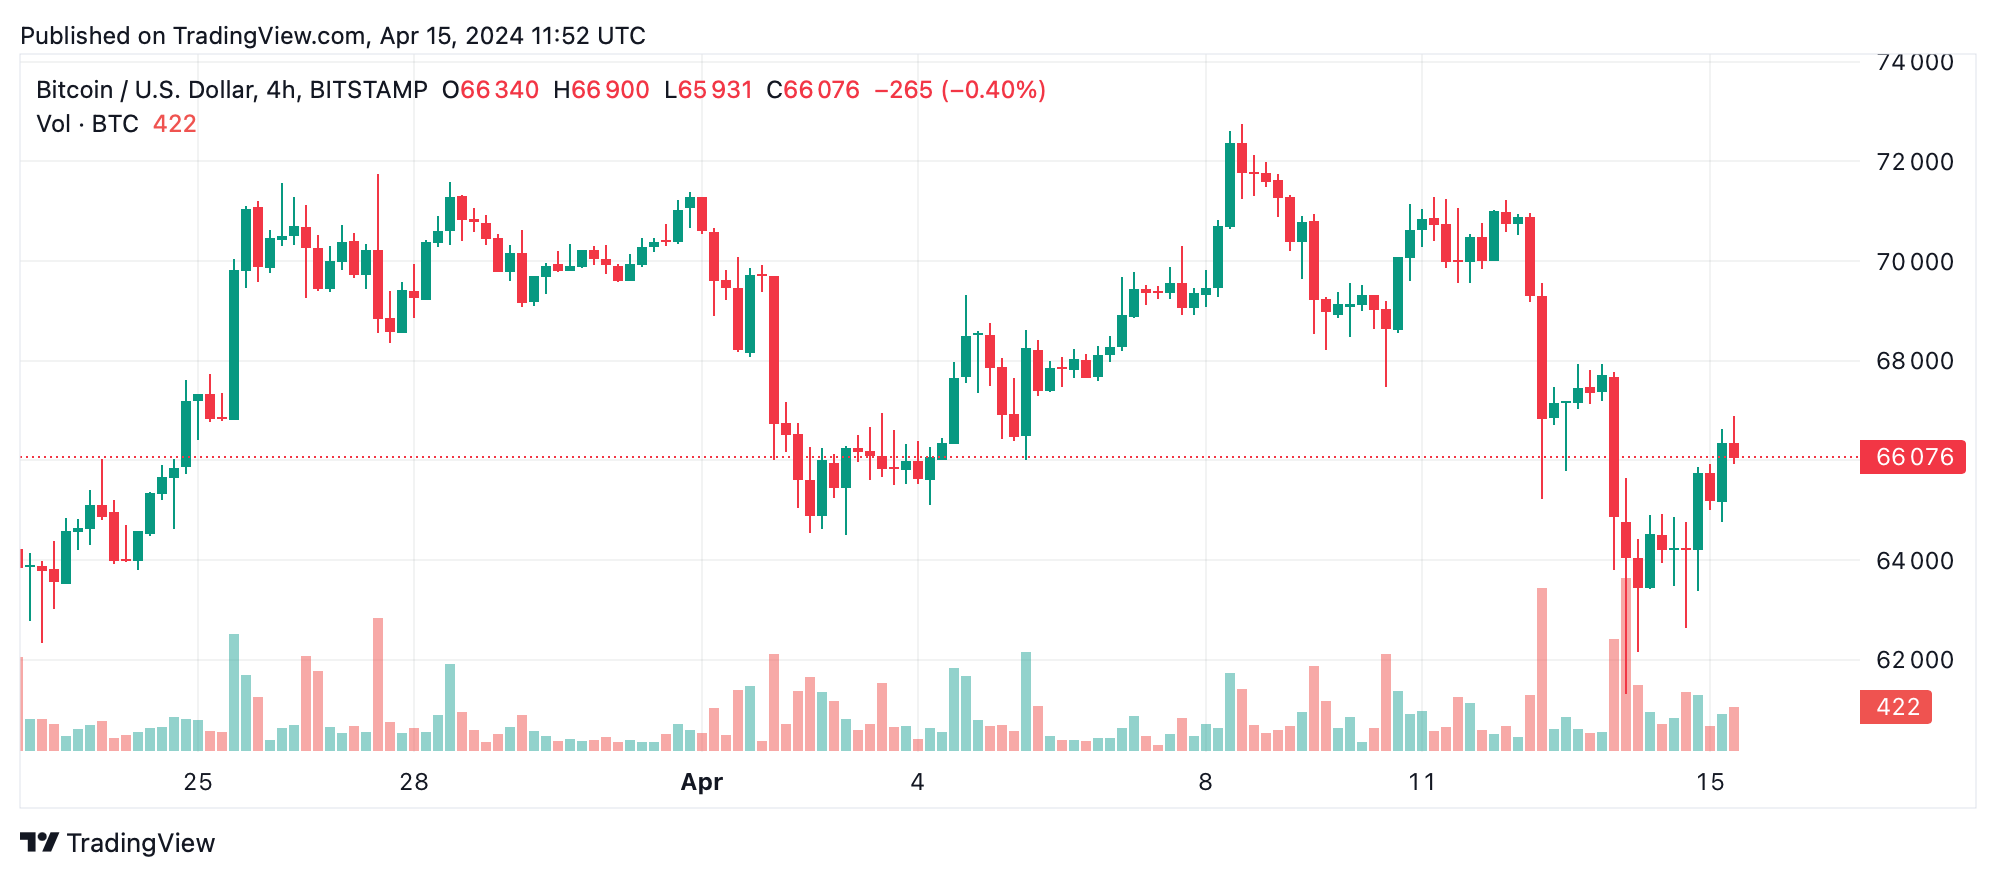
Bitcoin’s 4-hour chart captures more volatility with notable price swings, essential for understanding broader market directions. Although a rebound was observed, the failure to surpass previous highs at $71,287 suggests a lack of strong bullish conviction. Traders should consider entries on sustained breaks above this level, while a dip below $61,308 could signify a shift to bearish momentum, warranting an exit to prevent losses.
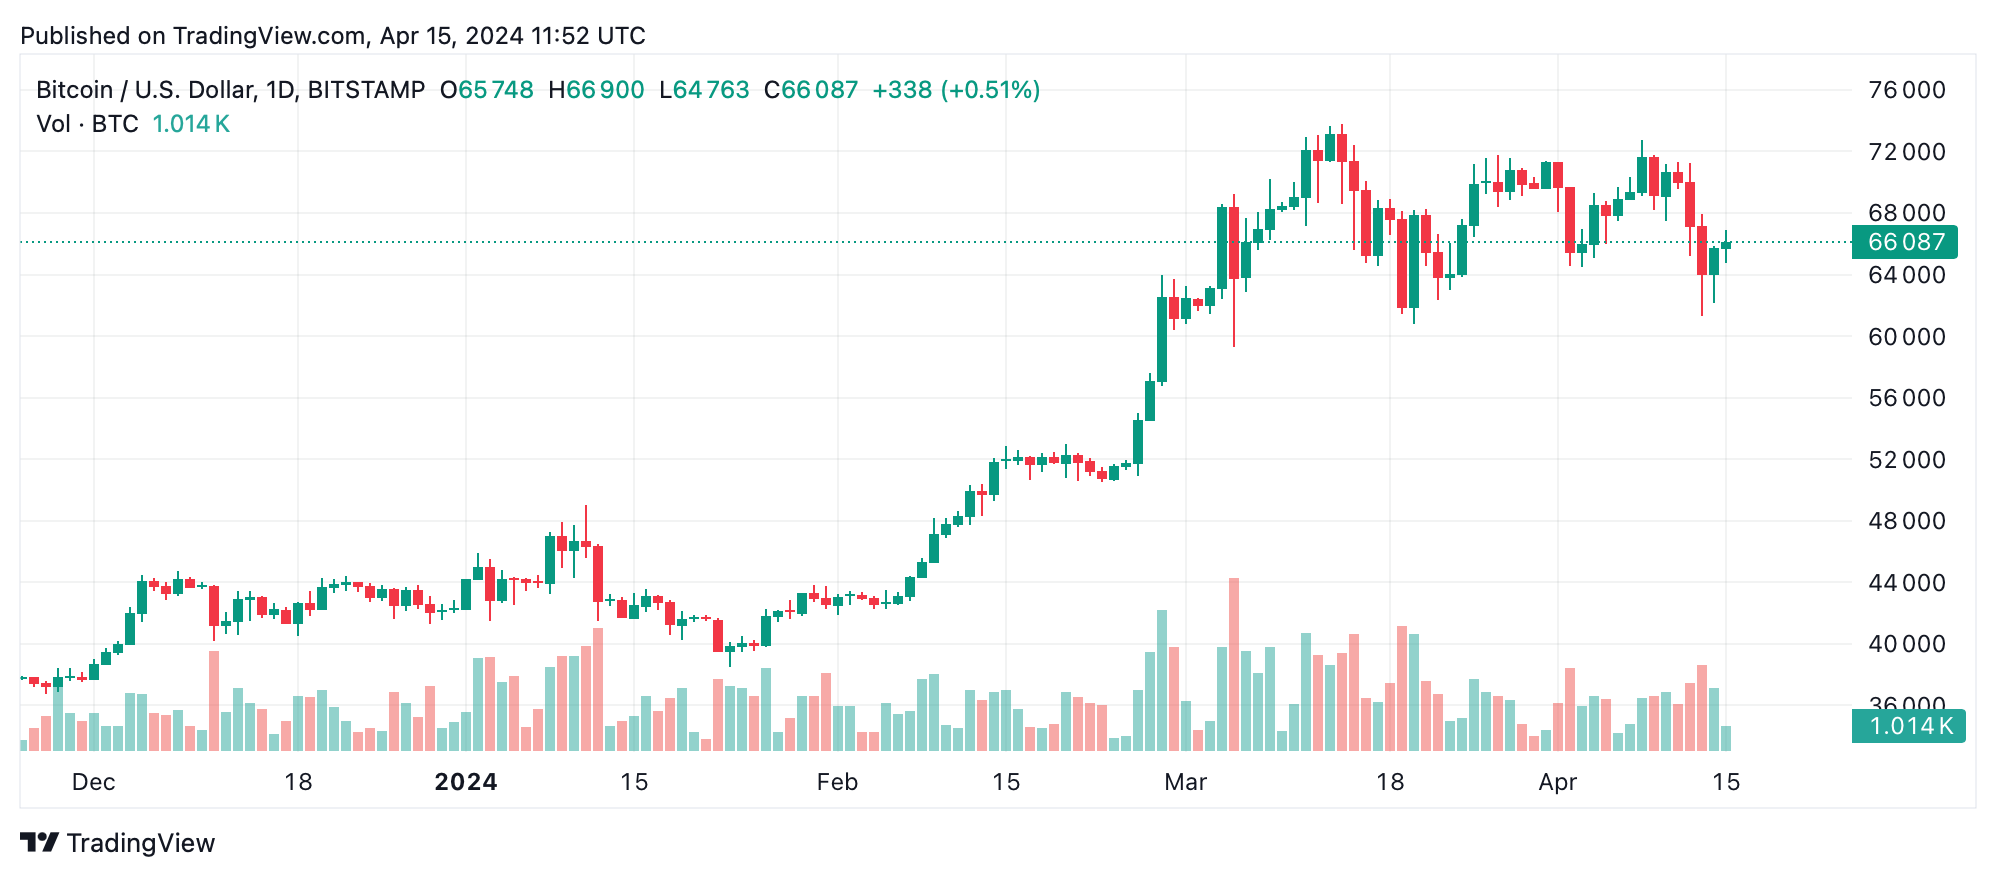
Extending our view to the daily chart, bitcoin’s recent recovery from a steep drop to the $60,000 range reveals a market testing its resilience. The long wicks on recent candles underscore ongoing volatility and traders’ indecision. A strategic entry might be warranted if prices push above recent highs, which could mark the start of a recovery phase. Conversely, a breach below $60,760 would confirm bearish dominance, acting as a cue for exits.
A comprehensive look at bitcoin’s moving averages (MAs) reveals a split sentiment; shorter-term averages like the exponential (EMA 10, 20, 30) and simple (SMA 10, 20, 30) suggest selling pressure, whereas longer-term averages (EMA and SMA 100, 200) indicate buying signals. This divergence calls for attention to longer-term bullish signals amidst short-term sell-offs.
Oscillators like the relative strength index (RSI) and Stochastic are currently neutral, providing little directional bias. However, the moving average convergence divergence’s (MACD’s) bearish signal juxtaposed with the momentum indicator’s bullish signal presents a conflicting scenario, urging traders to wait for more pronounced signals before making significant moves.
With a market capitalization of $1.30 trillion and a 24-hour trade volume of $45.24 billion, bitcoin’s substantial capital flow indicates strong market interest. However, the overall neutral stance of most oscillators combined with mixed signals from moving averages suggests that the market is in a state of flux, potentially gearing up for its next major move.
Bull Verdict:
Given the current consolidation and subtle signs of an upward break in the shorter time frames, coupled with long-term bullish signals from moving averages, there is a reasoned optimism for a potential bullish resurgence. Should bitcoin sustain a break above the critical resistance levels noted in the 4-hour and daily charts, it could signify the beginning of a robust upward trajectory.
Bear Verdict:
Conversely, the prevalence of sell signals across several short-term moving averages and the neutral-to-negative indications from key oscillators suggest that downward pressures remain significant. If bitcoin fails to maintain its current support levels and breaches the lower thresholds discussed, it would likely confirm a bearish trend.