
-
$BTC
$BTC ~USD" api="cryptocompare.com" realtime="true" animation="backgroundRedGreen"> continued its downtrend all the way to the green zone, making the move predicted in the “Will it start falling until halving?” analysis. - Yesterday’s analysis gave readers a gain of more than 15%.
- The current $BTC chart shows that the price has encountered buying from the green support range.
$BTC’s downtrend continued into the green zone as the move predicted in the “Will it start falling until the halving?” analysis materialized, with yesterday’s analysis showing a gain of more than 15%; currently, the price is trying to rally with buying from the green support range of $66,666 – $65,800.
MEDIUM TERM $BTC ANALYSIS
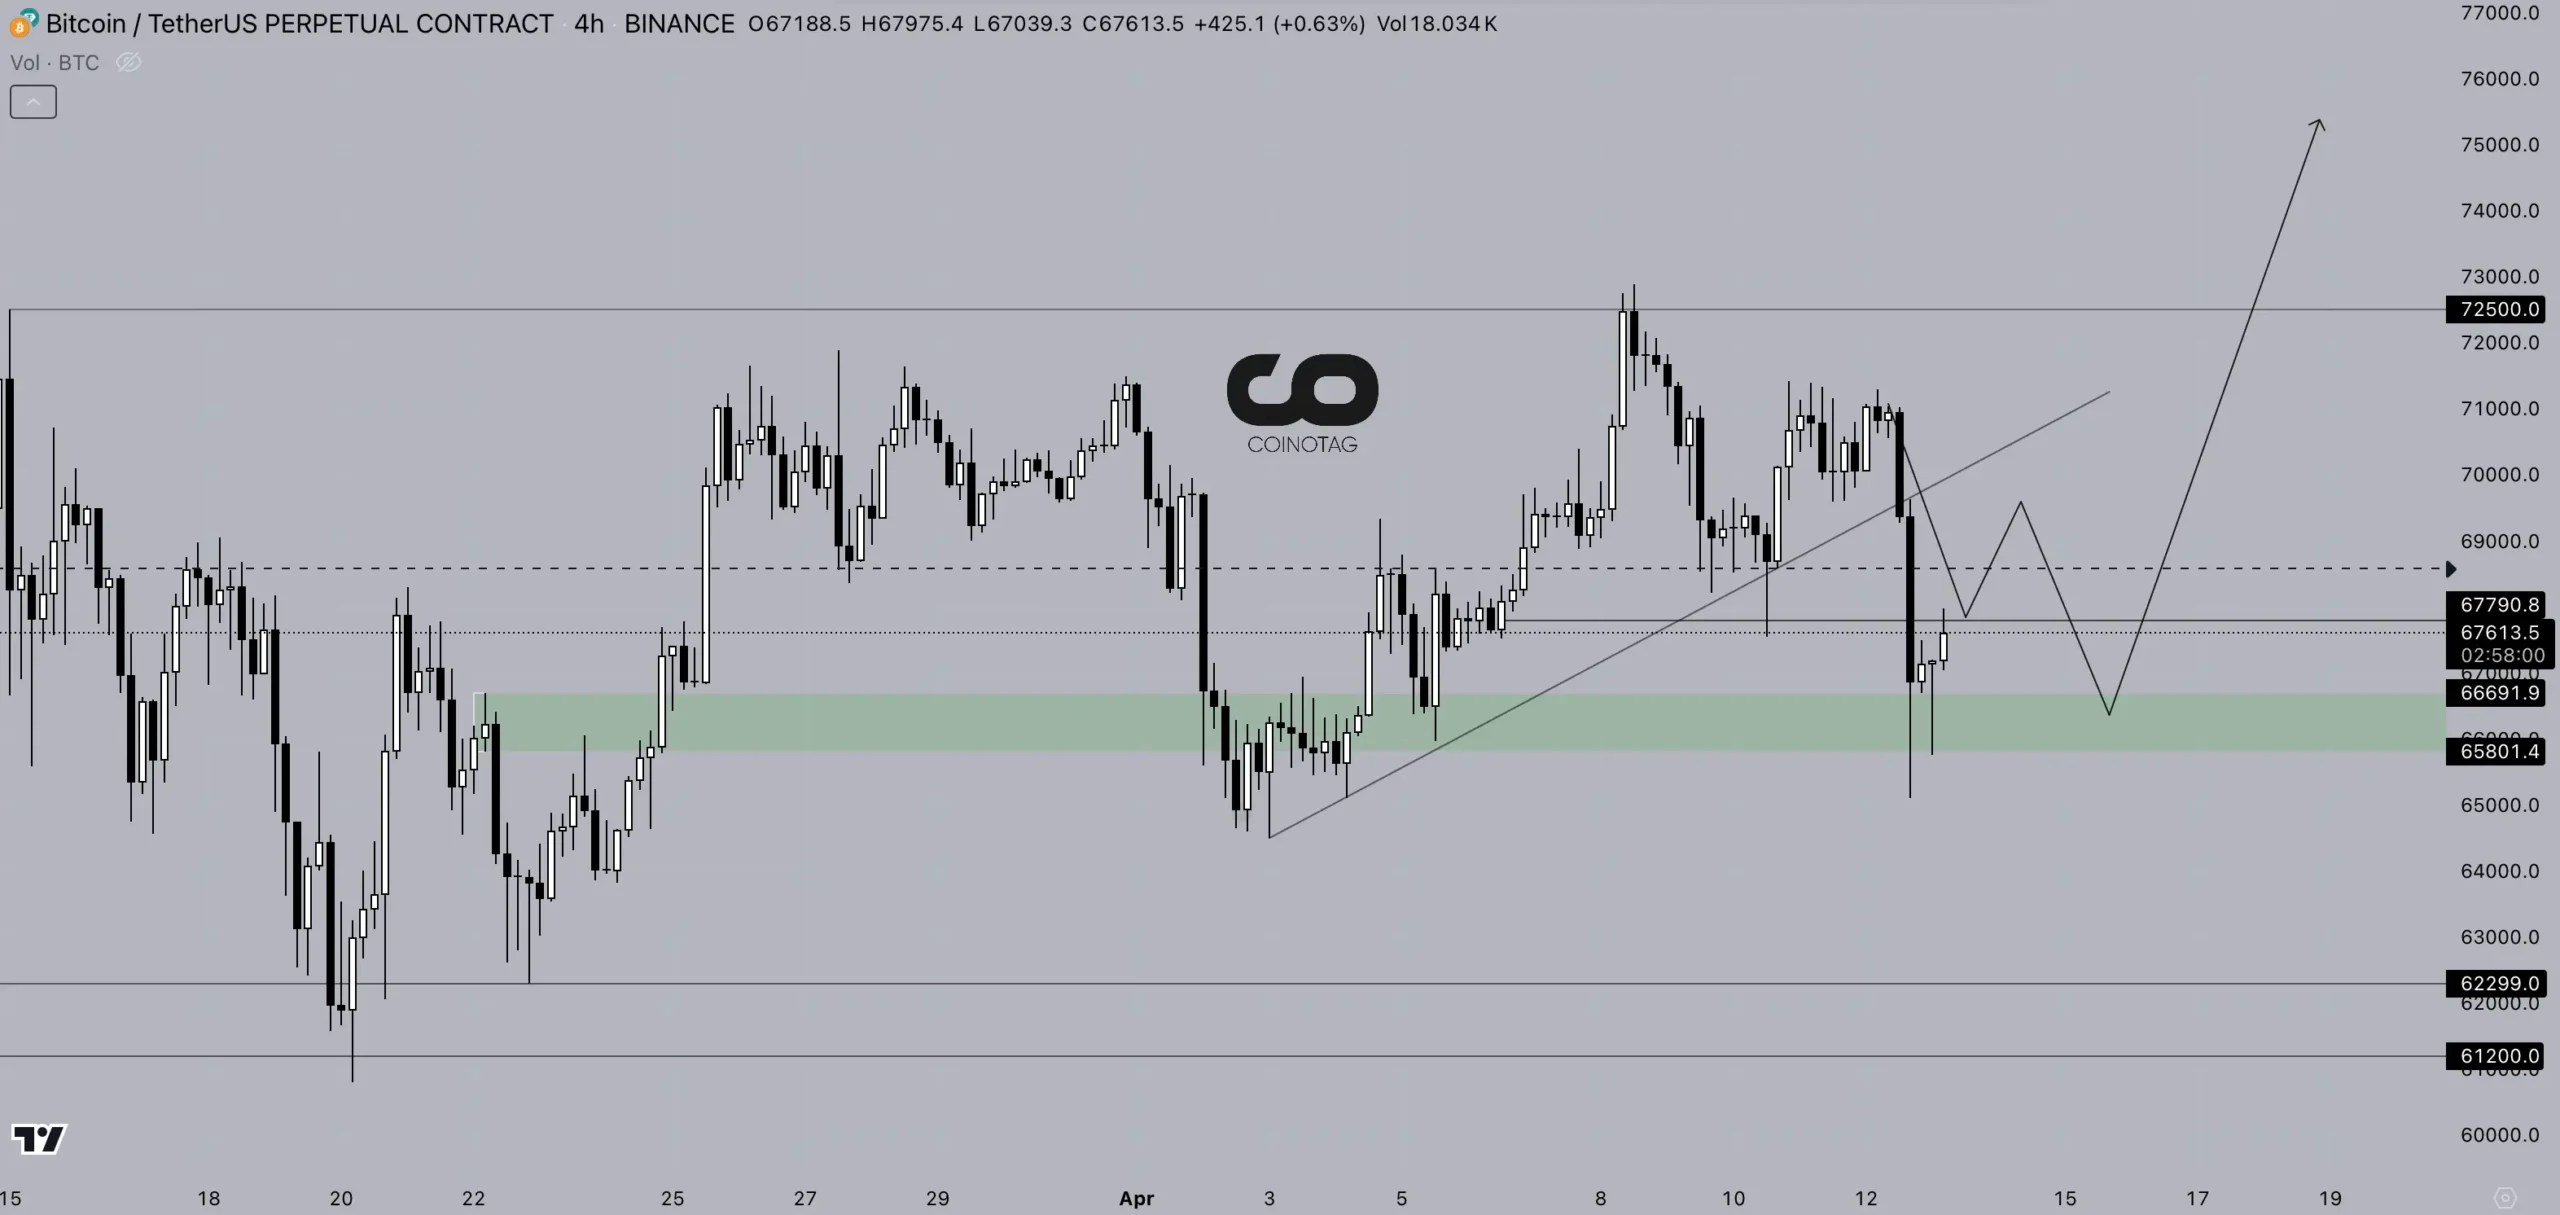
4-Hour $BTC/USDT Chart
According to Bitcoin’s 4-hour technical chart, the move predicted in yesterday’s “Will itstart to halve?” analysis appears to have materialized, with Bitcoin continuing its downtrend into the green zone.
Yesterday’s $BTC analysis returned more than 15% to trading readers. A look at the current $BTC chart shows that the price is attempting to rebound from the analysis’s green support range of $66,666 – $65,800.
As stated in the April 12 analysis, $BTC price may move sideways in the green zone and may target $75,000 as long as it stays above the green zone. However, if the price falls below the green support zone, the 4-hour candle closes below $65,000 can be used as a stop loss level.