As of April 12, 2024, bitcoin’s price exhibits resilience, trading at $70,748, with oscillators showing mixed signals while moving averages firmly suggest a bullish trend heading into the weekend.
Bitcoin
The relative strength index (RSI) on the daily scale sits at a neutral 56, indicating neither overbought nor oversold conditions, suggesting that $BTC has room to maneuver in either direction without immediate pressure from traders. Meanwhile, other oscillators like the Stochastic and commodity channel index (CCI) present neutral to mildly bullish signals, pointing to potential upward momentum without significant overextension. On the other hand, the moving average convergence divergence (MACD) level shows a bearish signal.
A detailed look at the moving averages (MAs) underscores a strong bullish sentiment across various time frames. Both exponential moving averages (EMAs) and simple moving averages (SMAs) from 10-day to 200-day periods are all signaling positive sentiment. This unanimity among short-term and long-term averages highlights a robust underlying strength in Bitcoin’s price trajectory, potentially indicating sustained bullish activity ahead.
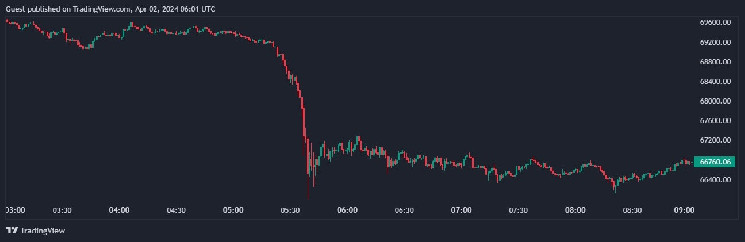
On the 1-hour chart, bitcoin displays marked volatility, with its price fluctuating between $69,550 and $71,287. This chart is particularly vital for day traders as it highlights critical points for entering and exiting trades. For example, a revisit to the lower limit of $69,550 could present an appealing opportunity to buy, whereas reaching the peak of $71,287 might suggest a favorable moment to sell and benefit from the short-term price movements.
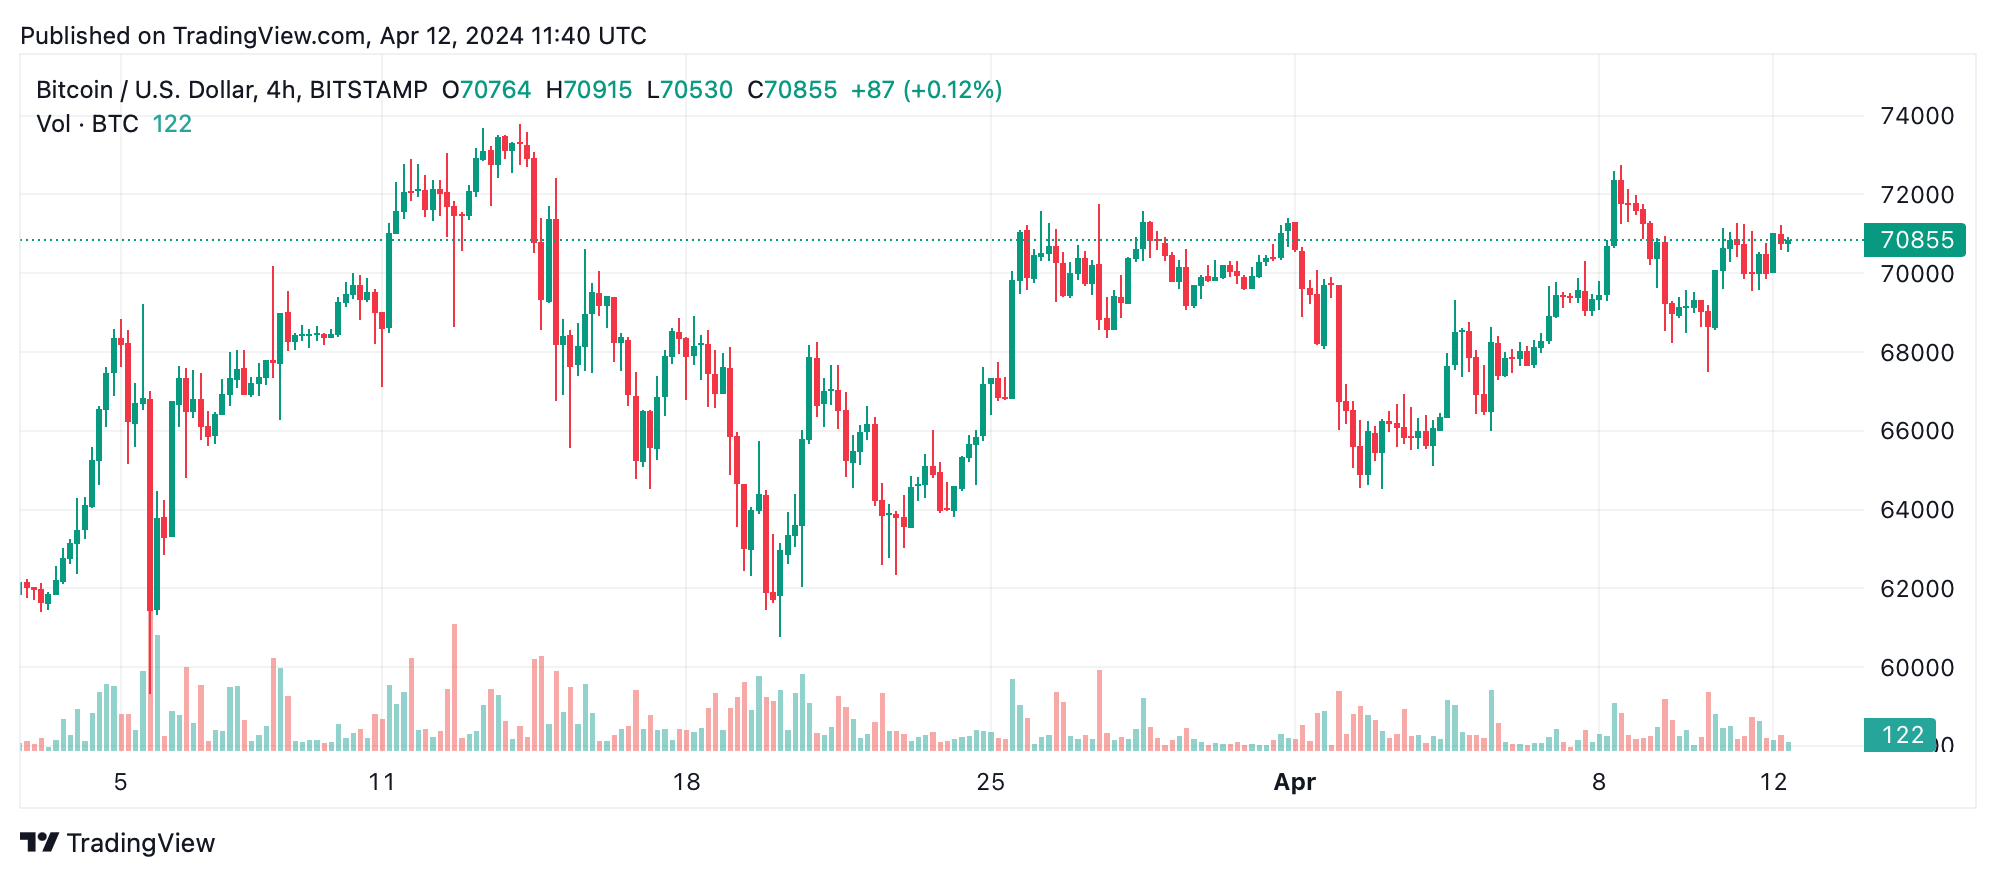
The 4-hour chart provides a more extended view, spanning several days, and pinpoints crucial support at $67,482 and resistance at $72,756. This wider lens is essential for evaluating the mid-term trajectory of the market. Traders might consider buying on dips to the strong support level or starting trades on a climb above $72,756, indicating the potential for continuing the upward trend.
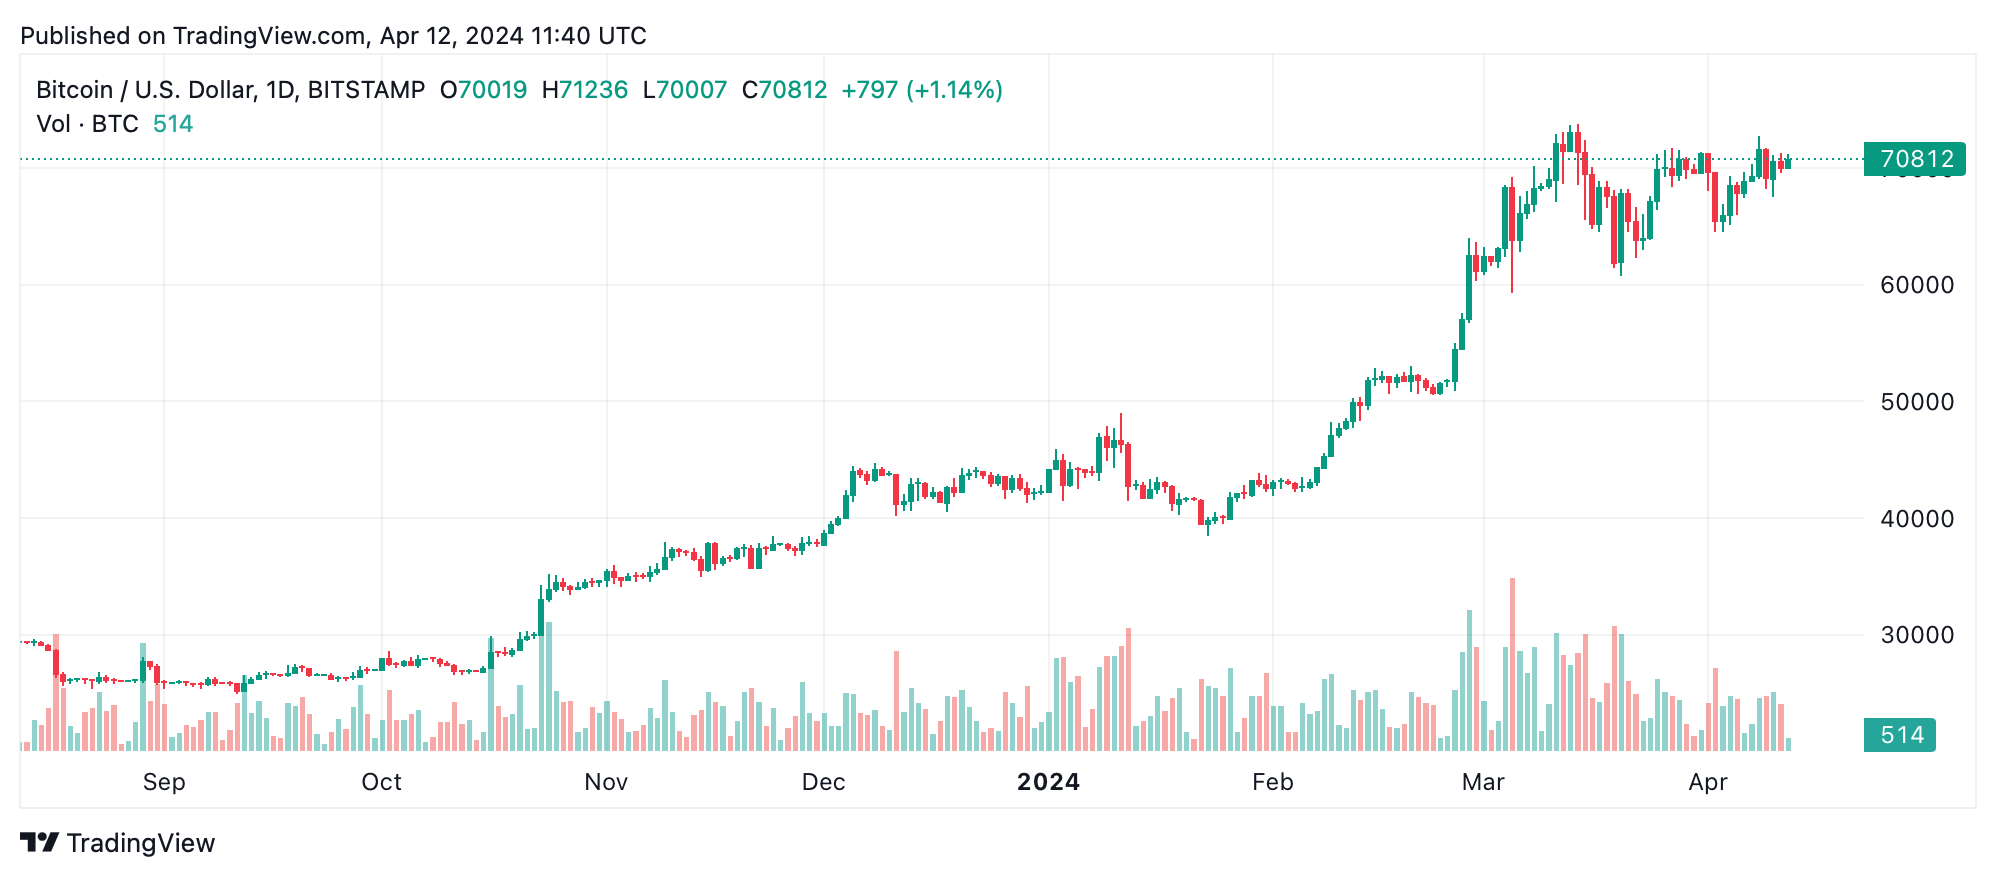
Long-term analysis through the daily chart reveals a consolidation pattern, with significant historical support at $60,760 and recent peaks around $73,794. This chart is key for formulating long-term strategies, where a daily close above the recent highs might indicate a bullish trend, prompting trades based on anticipated prolonged upward movement.
Bull Verdict:
Given the strong support from moving averages across multiple time frames and the neutral to bullish signals from various oscillators, the outlook for $BTC remains optimistic. The consistent bullish signals from both short-term and long-term averages, coupled with the ability to maintain key support levels, suggest that bitcoin is positioned for further upward movement.
Bear Verdict:
Despite the bullish indicators from MAs, the mixed signals from oscillators like the MACD and momentum should not be overlooked. The presence of a bearish signal in the MACD level and only a neutral stance in other key oscillators could indicate underlying market hesitations. If $BTC fails to hold critical support levels or shows weakness at resistance points, this could signal a potential reversal or a slowdown in upward momentum.