
Bitcoin’s price movements on April 10, 2024, showcased a day of significant volatility, with the cryptocurrency’s value swinging between $68,207 and $70,917. Oscillators and moving averages paint a complex picture of neutrality and cautious selling signals, amidst a backdrop of a $1.35 trillion market capitalization. Bitcoin’s stance of neutrality and period of consolidation precede the release of the U.S. Consumer Price Index (CPI) report.
Bitcoin
As bitcoin (BTC) hovers around $69,028, its 24-hour trade volume reaches $32.92 billion, highlighting a day filled with trading fervor. The broad range of intraday prices reflects a market in search of direction, underpinned by a substantial market capitalization of $1.35 trillion. This liquidity and volatility create a fertile ground for both short-term traders and long-term investors to reevaluate their positions.
BTC oscillators, including the relative strength index (RSI) and Stochastic, currently signal neutrality, suggesting a market in balance. However, the momentum and moving average convergence divergence (MACD) level indicate sell signals, hinting at the potential underlying bearish sentiment. Meanwhile, moving averages predominantly advocate for bullish action, with both the simple (SMAs) and exponential moving averages (EMAs) across various timeframes leaning towards a bullish outlook, albeit with a cautionary note from the 10-day EMA.
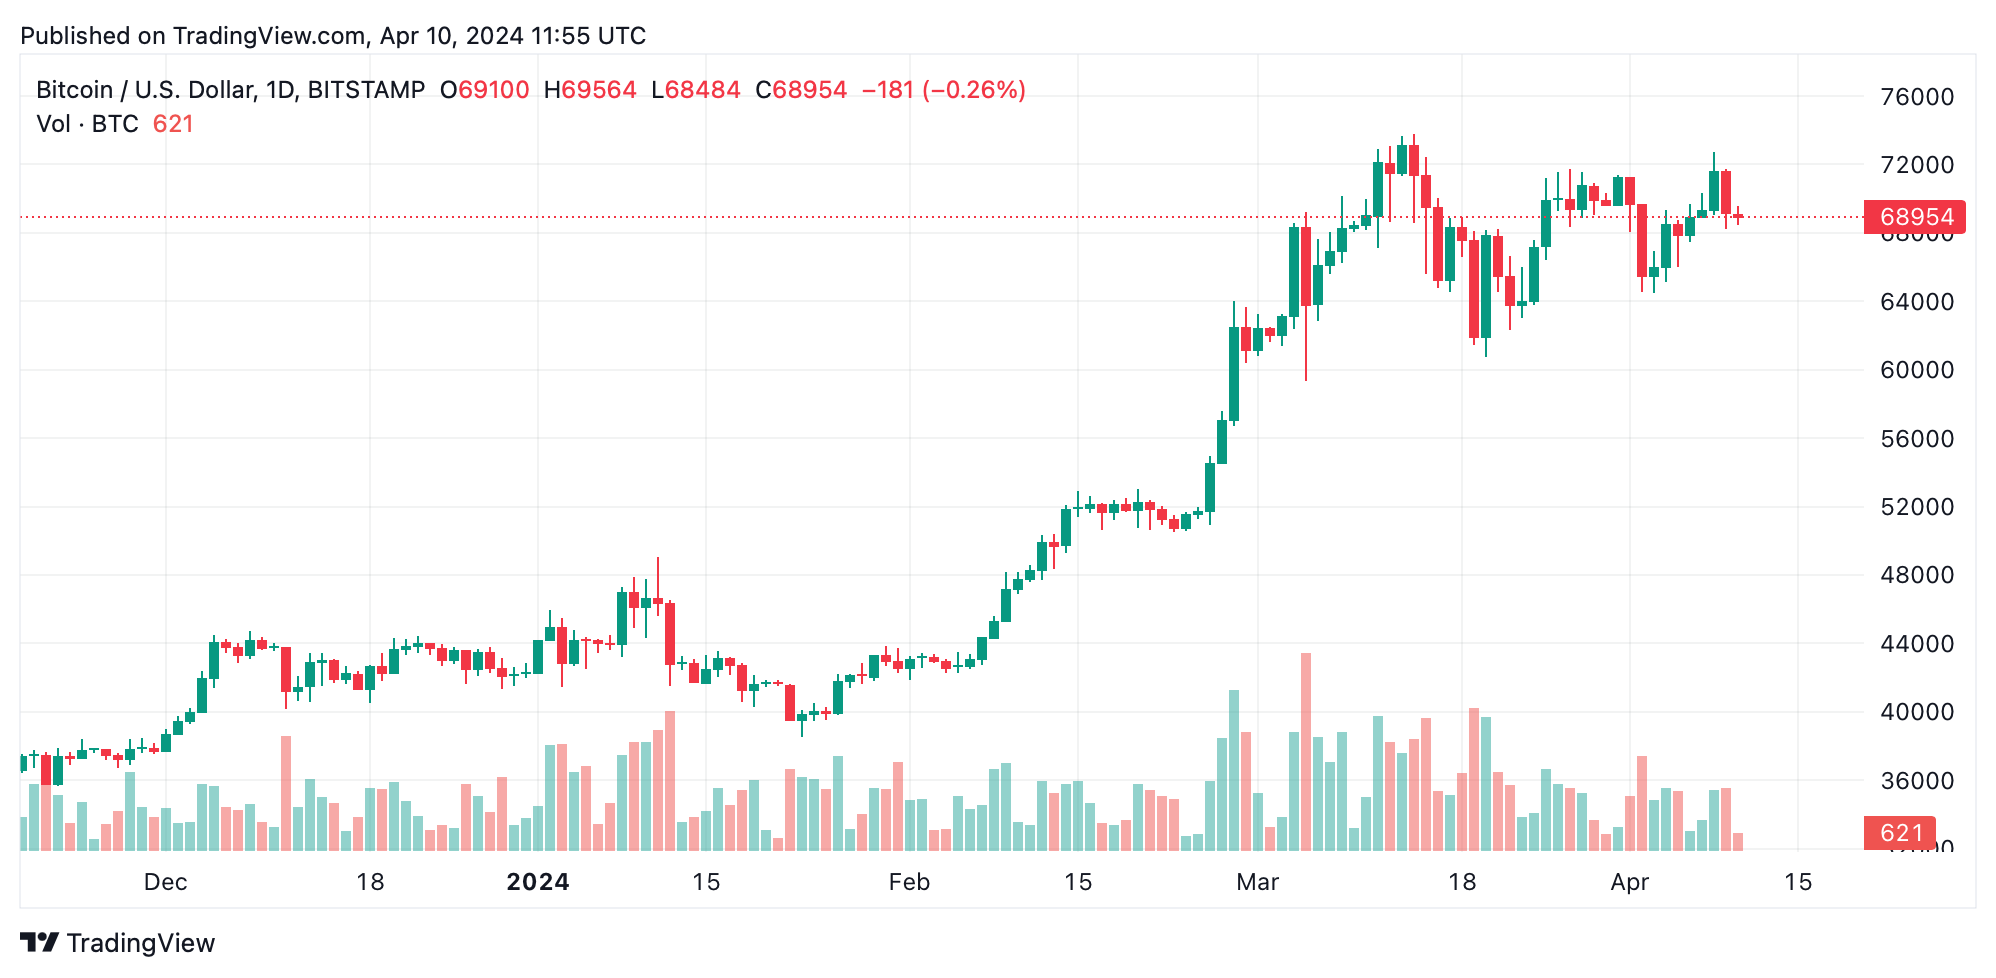
Analyzing the daily chart, the witnessed volatility with peaks and troughs signals a market grappling with its next move. The consolidation phase, characterized by smaller market movements, points towards indecision among investors. Without a clear bullish signal, the current stance leans towards a watchful waiting.
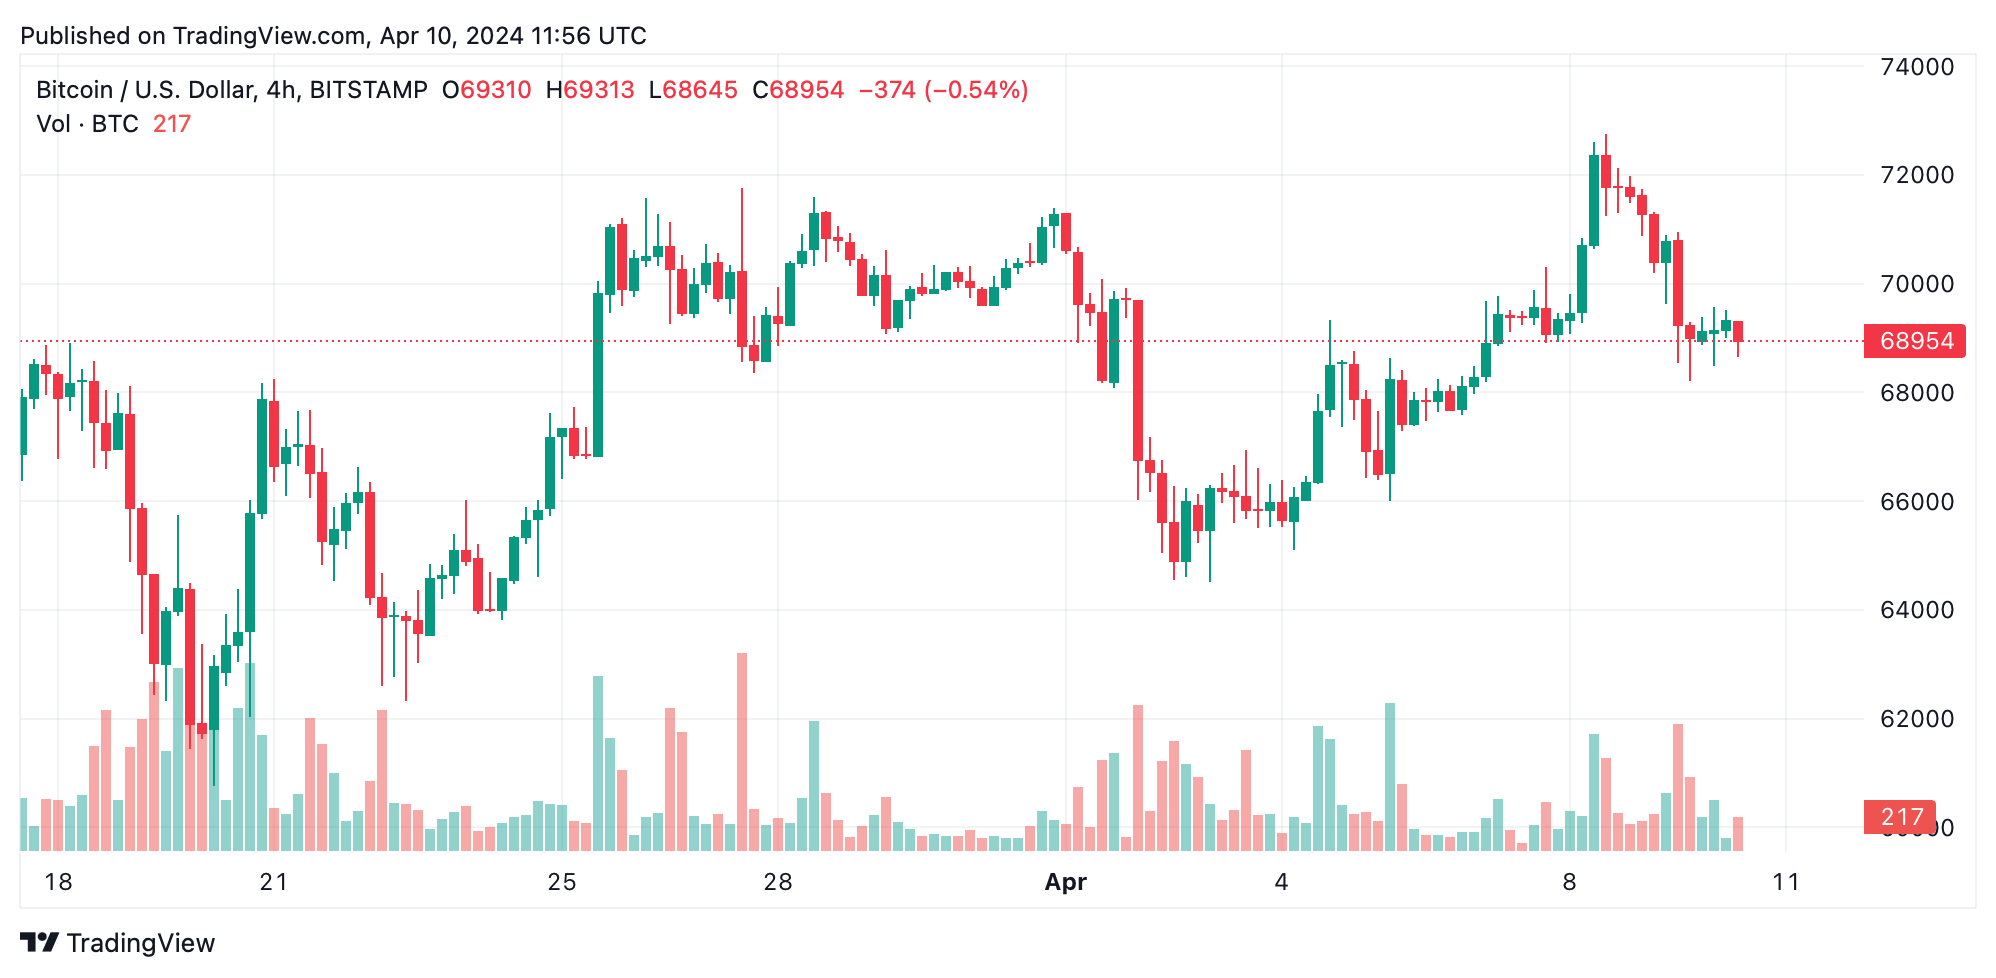
The 4-hour chart offers insights into a short-lived rally and subsequent downturn, suggesting a market searching for equilibrium. The balance between buying and selling forces, as evidenced by the mix of ups and downs, highlights a critical period of indecision. For those looking to enter the market, identifying a breakout or support level bounce could serve as a key strategy, with volume as an essential confirmation indicator.
The hourly chart reveals a more nuanced view of bitcoin’s price action, showing a downtrend punctuated by lower highs. This granularity allows for the identification of potential bullish reversal patterns or the consideration of exits should the downtrend continue, marked by the recent low of $68,217. This level serves as a pivotal point for traders to gauge the market’s next direction.
Bull Verdict:
The analysis of bitcoin’s market behavior on April 10, 2024, amidst the backdrop of neutrality in oscillators and a strong leaning towards buying in moving averages, suggests underlying strength. Despite the daily chart’s indecision and the mixed signals from the hourly and 4-hour charts, the predominance of bullish signals across various moving averages, coupled with the resilience in bitcoin’s price above significant historical support levels, indicates potential for upward momentum.
Bear Verdict:
Despite the apparent equilibrium in market sentiment as indicated by the neutral stance of most oscillators and the bullish bias in moving averages, the presence of sell signals from key indicators such as the momentum and MACD Level, combined with the recent downtrend in the hourly chart, signals potential underlying weakness in bitcoin’s market structure.