Bitcoin’s (BTC) price recently posted a new all-time high and has since been attempting to do it again.
Looking at the chart, it seems that a long-term bullish outlook is the possible outcome. However, investor behavior suggests differently.
Bitcoin Breaks Out
Bitcoin price has been enjoying the bullishness emanating from the consistent accumulation noted by the investors. In the past week alone, the total supply of all exchanges has declined from 812,000 BTC to 799,000 BTC. This suggests that close to 13,000 BTC worth over $926 million has moved from exchanges to investors’ wallets.
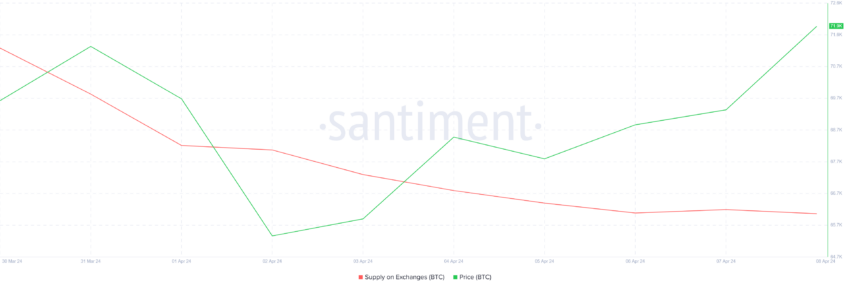
This is a sign that BTC holders are expecting a further rise in price, which seems to be the case based on this pattern.
On the 3-day chart, Bitcoin is validating the Wyckoff pattern, a technical analysis concept that identifies trends and potential reversals in financial markets. It analyzes price and volume movements to discern accumulation, distribution, or markup phases.
Read More: 5 Best Platforms To Buy Bitcoin Mining Stocks Ahead of 2024 Halving
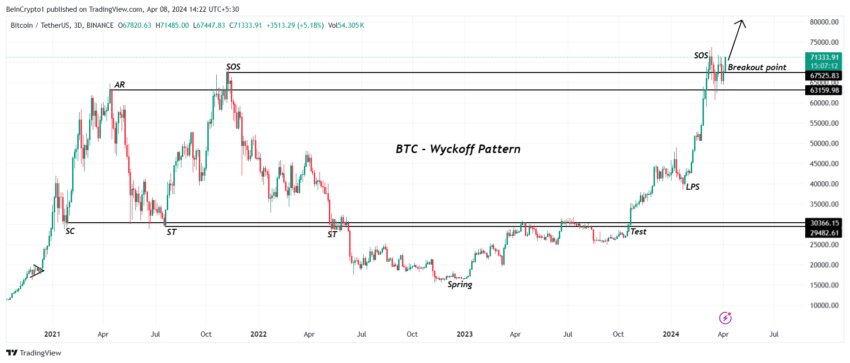
At the moment, Bitcoin price is breaking out of the pattern of resistance, which indicates that BTC will continue to rally over the coming trading sessions.
BTC Price Prediction: Another Rally Next
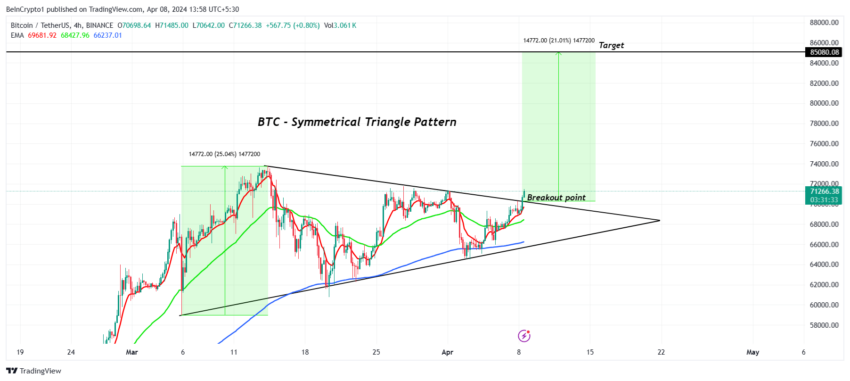
While the long-term target is rather difficult to identify given the unprecedented, unaccountable factors, it seems like the short-term target for Bitcoin price will be $85,000. This is drawn from the symmetrical triangle trading pattern BTC is observing at the moment.
This pattern is characterized by converging trend lines, forming a triangle shape. It indicates a period of indecision in the market, with prices consolidating between higher lows and lower highs. A breakout could lead to a significant price movement.
Based on the pattern, the target is set 21% above the breakout point, coming in slightly above $85,000. Thus, investors should expect a rally down the line.
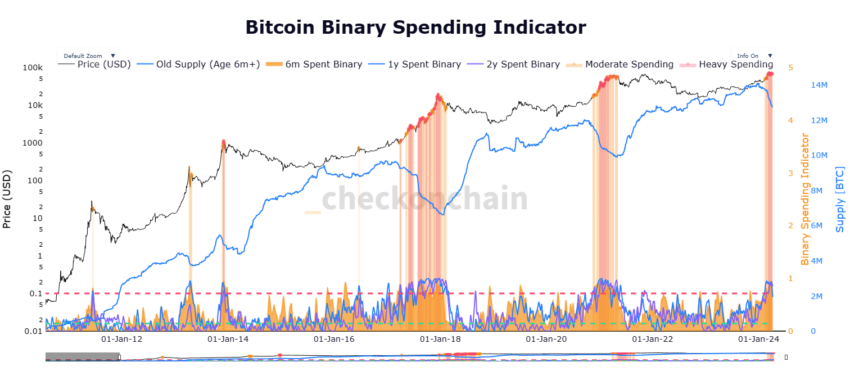
However, another major factor that could invalidate this bullish thesis is the realization of long-term holder profit. Historically, following new all-time highs, these holders tend to book profits, which results in Bitcoin price correction over the coming weeks.
Read More: How To Get Paid in Bitcoin (BTC): Everything You Need To Know
If this happens to be the case with BTC as well following the halving, Bitcoin price could correct, potentially falling back to $60,000.