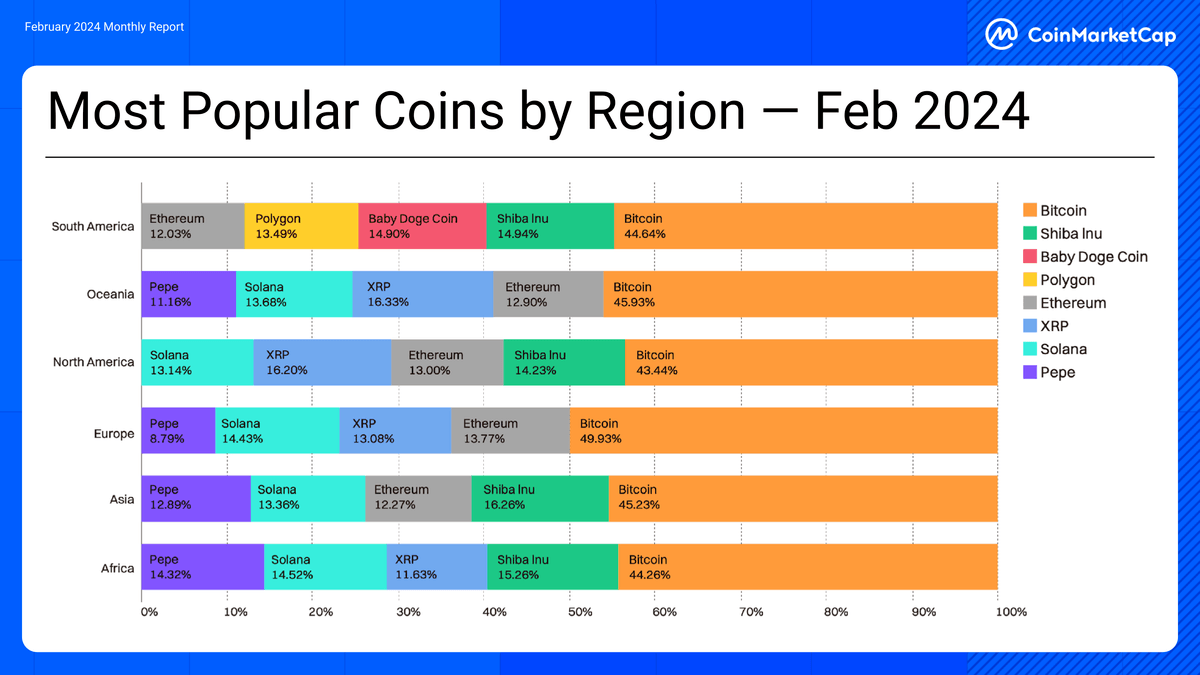
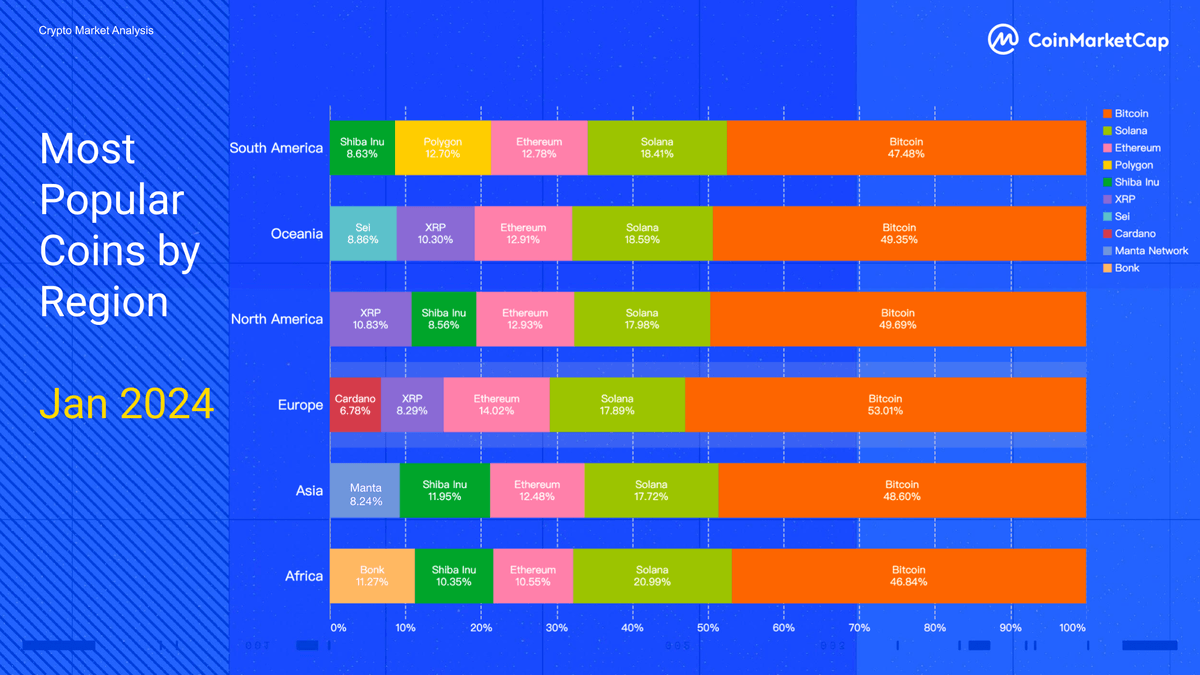
This actually represents a 3% drop compared to similar data for January, yet Bitcoin comfortably remains the most popular cryptocurrency amongst traders in all regions of the world, with investors in Europe the likeliest to hold BTC.
The move from January to February also reveals some interesting shifts in ownership for other cryptocurrencies, with Shiba Inu (SHIB) seeing noticeable spikes in North and South America, Asia and Africa.
At the same time, ownership of Solana has decreased noticeably in all regions, with many investors turning to smaller-cap coins and meme tokens in the wake of the rally that followed January’s Bitcoin ETF approvals.
Of course, with the cryptocurrency market remaining unpredictable and volatile, traders shouldn’t expect the same trends to continue throughout the year.
Instead, they should prepare for the possibility that the market will cyclically shift from overbought to underbought tokens, particularly as it moves from Bitcoin season to alt season (and back again).
Bitcoin and Ethereum Continue to Dominate Despite Dips
It’s perhaps unsurprising that half or nearly half of all cryptocurrency investors in all regions of the world own some BTC.
Ownership ranged from 49.93% in Europe to 43.44% in North America, yet such percentages represent a slight but noticeable dip compared to January, when 53% of European and 49.7% of North American crypto owners held some Bitcoin.
 Source: CoinMarketCap
This decline is interesting.
The most probable explanation is that some investors and traders moved out of BTC and took profits when the cryptocurrency rallied in February, as Bitcoin ETF volumes increased.
Much the same applies to Ethereum, which saw its popularity decline slightly in all regions in February, while in Africa it actually disappeared completely.
As with Bitcoin, some may have decided to take profits, while moving into smaller alts.
The Rise (and Fall) of Altcoins
In fact, this is more or less exactly what we see in the CoinMarketCap data, with several alts seeing increases in ownership from January to February.
In America, Asia and Africa, Shiba Inu (SHIB) ownership rose from 8.5%-11.9% in January to 14.2%-16.2% in February.
This is a noticeable spike, and what’s interesting is that the SHIB price didn’t rally big this year until the very end of February and then early March.
This suggests that at least some retail traders can be ahead of the curve, although with a meme coin such as SHIB it’s always possible that online and social media-based FOMO goaded investors to buy the coin, before it rallied.
We also see a big surge in ownership for PEPE, one of the market’s other big meme coins.
Interestingly, it didn’t even register in CoinMarketCap’s January data, yet by February, ownership had risen to 8.79% for Europe, 11.16% for Oceania, 12.89% for Asia, and 14.32% for Africa.
This likely follows from the sharp rally PEPE enjoyed in the final week of February, which was a prelude to its even bigger rally in March.

Yet something different applies to Solana (SOL), which saw a slight but significant decline in ownership between January and February.
As the chart above illustrates, it went from 17.7%-20.9% ownership in all regions of the world to 13.1%-14.5% in the following month.
This time, it’s arguable that some traders wanted to cut their losses, since after a strong end to 2023 SOL spent much of January declining, with some traders potentially exiting to more promising coins.
The Importance of Localism and Word of Mouth
Finally, one other interesting entrant is Baby Doge Coin (BABYDOGE), which gained a 14.9% share of popularity in South America, after appearing nowhere in January.
What’s intriguing about this is that it shows how cryptocurrency popularity and ownership can be dependent less on actual prices and fundamentals, and more on social contagion and word of mouth.
So, if a few influencers in South America begin hyping a coin, it almost inevitably starts to gain in popularity.
This principle helps to explain much of the geographical variation we see in cryptocurrency popularity, since as a global market, popularity should be uniform if all investors are 100% rational actors.
They aren’t, of course, which is why we should continue to expect variation in next month’s data, as well as changes in popularity within regions and across time.
 cryptonews.com
