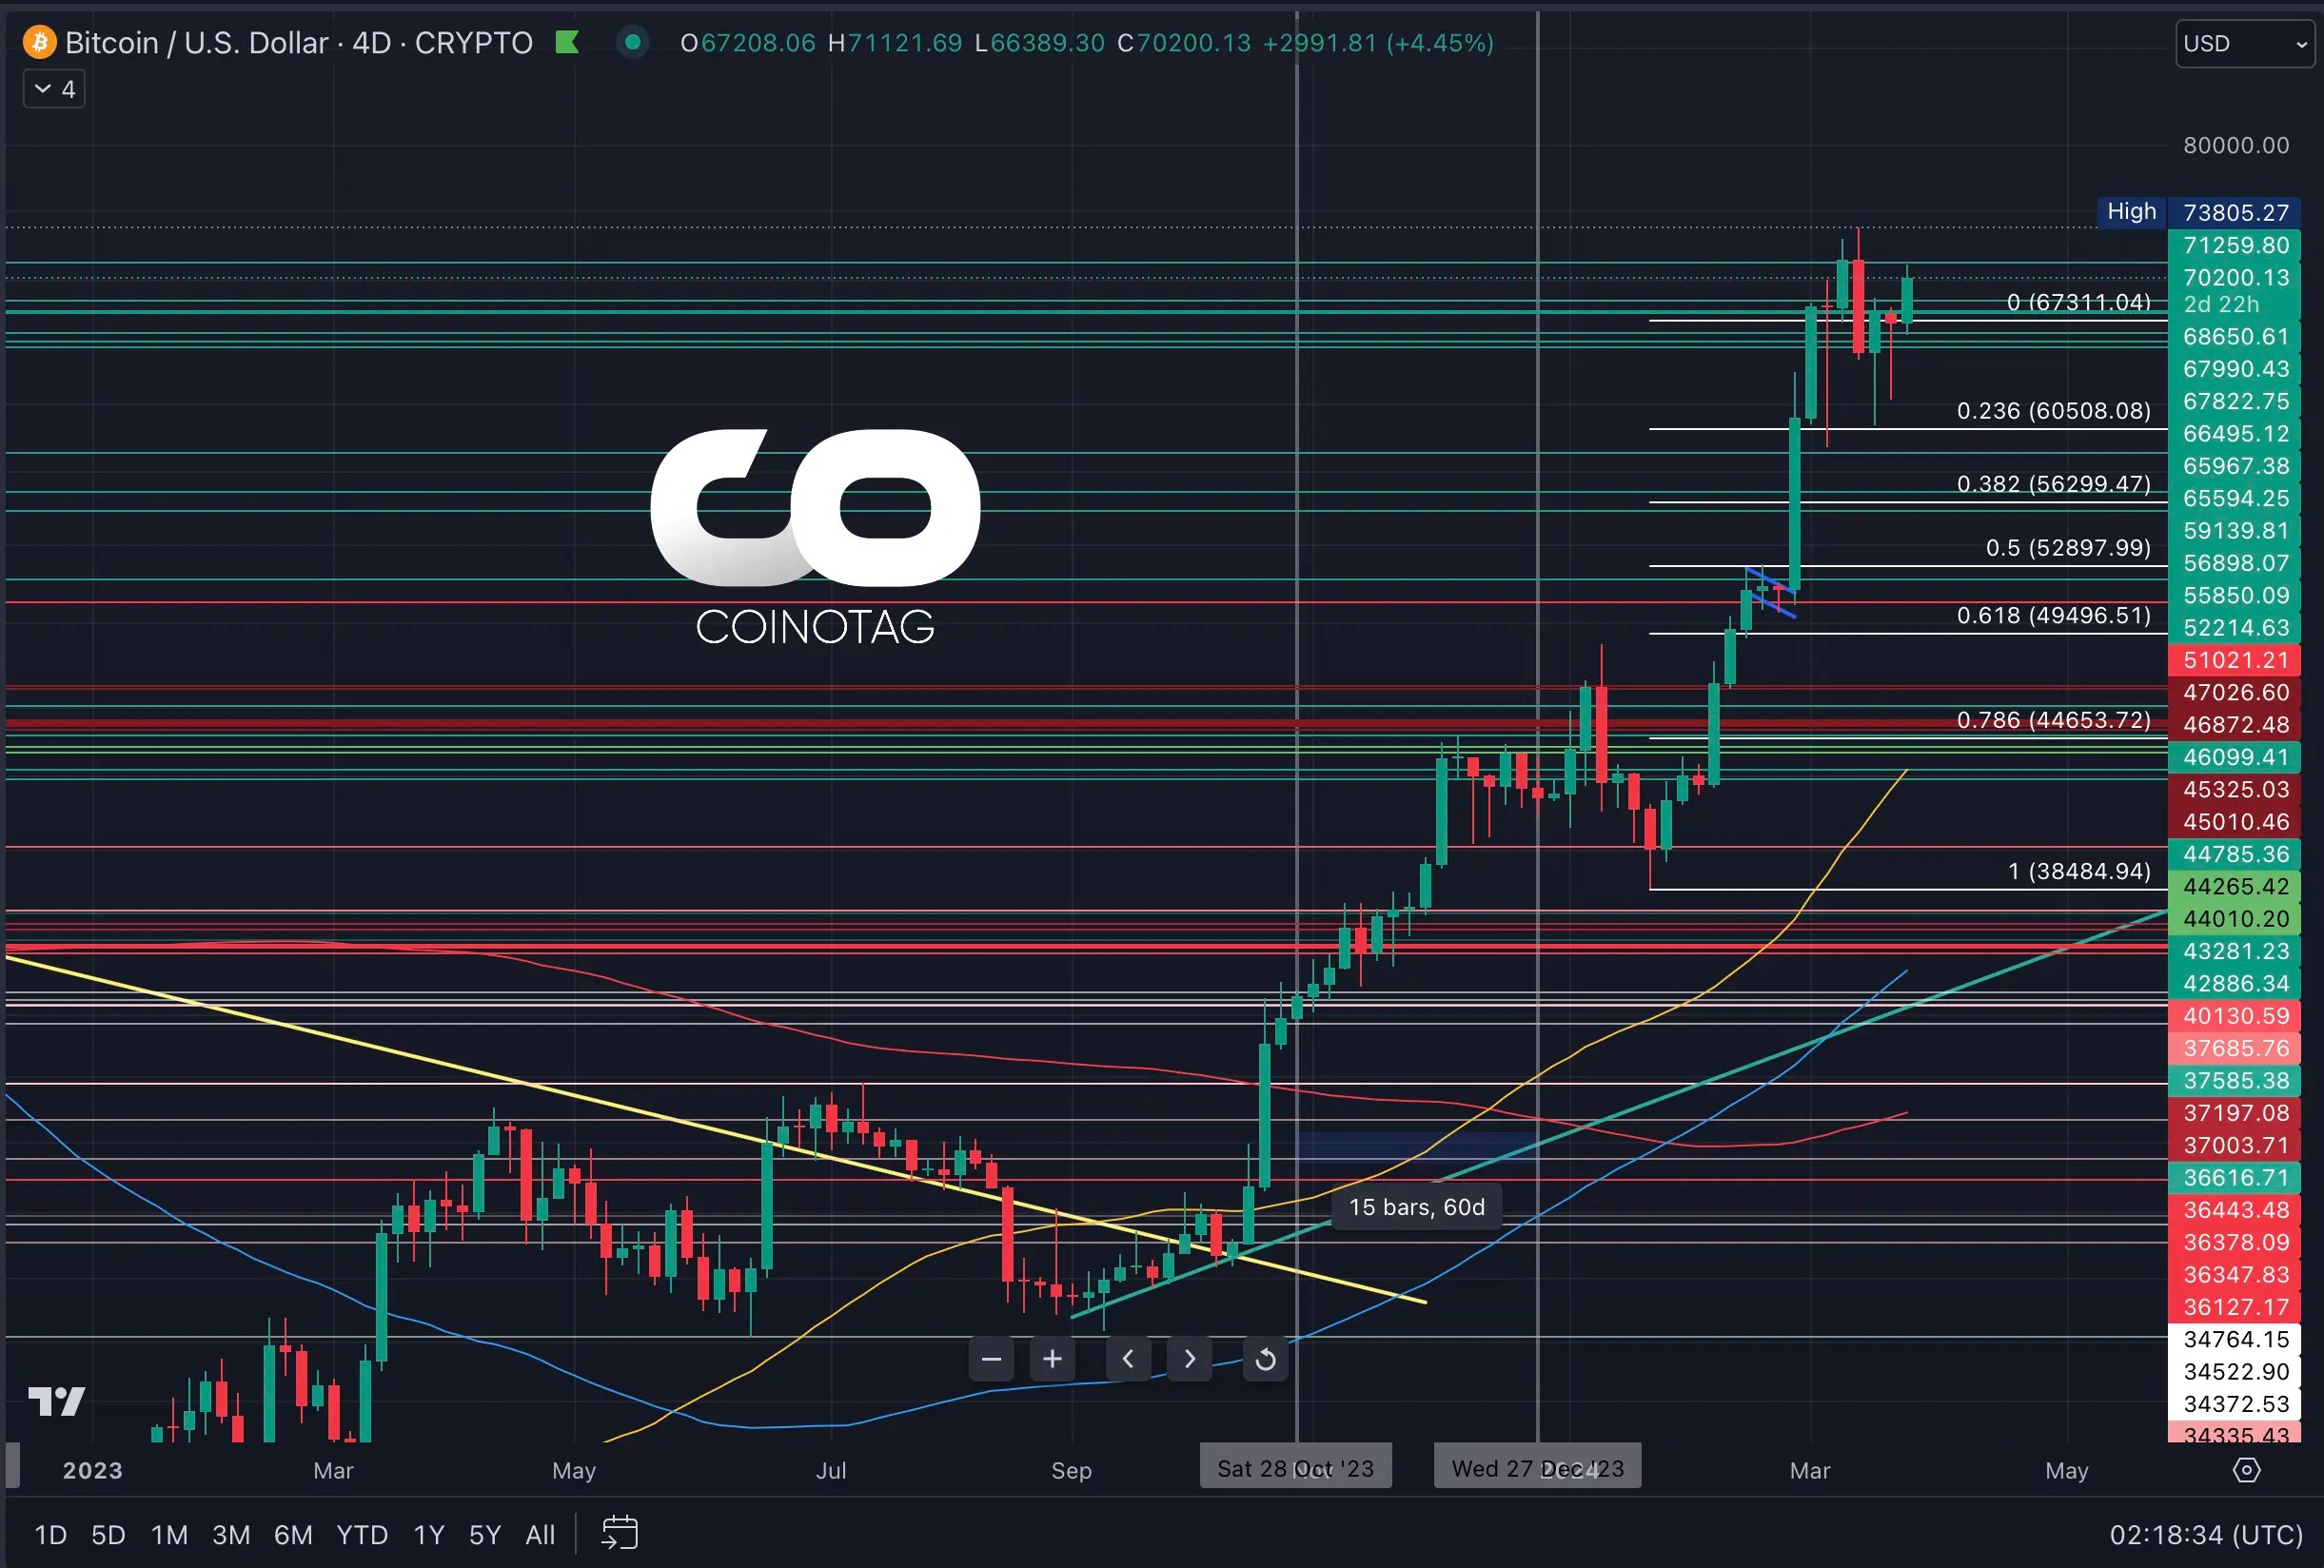
Bitcoin has decisively broken through the $70,000 resistance level, fueled by renewed bullish momentum. This follows a consolidation phase above $65,000, where $BTC exhibited resilience and established a solid base for its upward trajectory. Technical indicators suggest that the rally could extend toward the $73,000 and $75,000 levels.
Key Technical Factors Behind the Surge
Several factors underpin Bitcoin’s bullish outlook:
* Moving Averages: $BTC is trading comfortably above the 100-hour Simple Moving Average (SMA), a bullish sign.
* Trendline Support: A bullish trendline on the hourly chart near $67,500 offers immediate support.
* Fibonacci Retracement: The price has pulled back to the 23.6% Fibonacci retracement level, a potential launching pad for further gains.
Potential Upside and Downside Scenarios
Upside: A clear break above $71,200 could propel $BTC to the next major resistance at $73,500, with a subsequent target of $75,000.
Downside: If $BTC fails to hold above $70,000, it could slide towards support levels at $69,000 and $67,800 (trendline support). A breach of $67,800 might trigger further declines towards $66,800 and $65,500.
Conclusion
Bitcoin’s break above $70,000 strengthens its bullish narrative. While short-term volatility is expected, the overall market sentiment leans towards the upside. Investors should watch for key resistance levels and monitor technical indicators to gauge Bitcoin’s next move.

 en.coinotag.com