Bitcoin’s price has recently found support around the significant $60K price level, initiating a period of sideways consolidation correction. However, buyers are aiming to reclaim the $73K threshold in the mid-term, propelling the price towards a new all-time high.
Technical Analysis
By Shayan
The Daily Chart
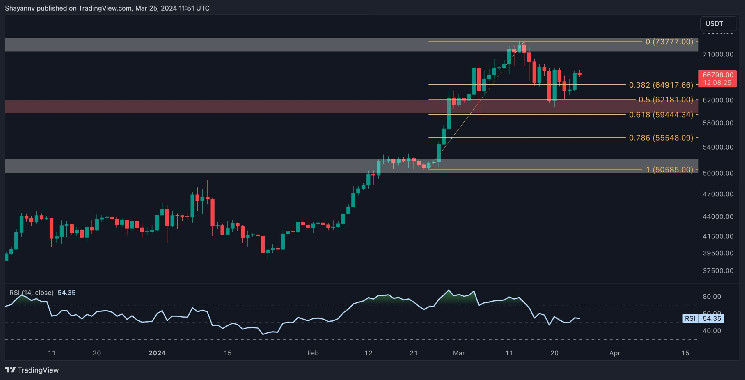
A detailed analysis of the daily chart indicates that Bitcoin’s price has entered a mid-term corrective phase following a notable surge towards the all-time high of $73K. This consolidation has extended towards the crucial support region, delineated by the 0.5 ($62K) and 0.618 ($59.5K) Fibonacci retracement levels, where demand currently outweighs supply.
Consequently, this increased buying pressure halted the ongoing retracement, triggering a significant reversal towards the $66K threshold. Nonetheless, the price appears to have entered a mid-term period of sideways consolidation between the support region of $60K and the substantial resistance of $73K until a breakout occurs. Overall, the prevailing outlook remains bullish, with the potential for the price to breach the upper boundary of this range, setting a new all-time high.
The 4-Hour Chart
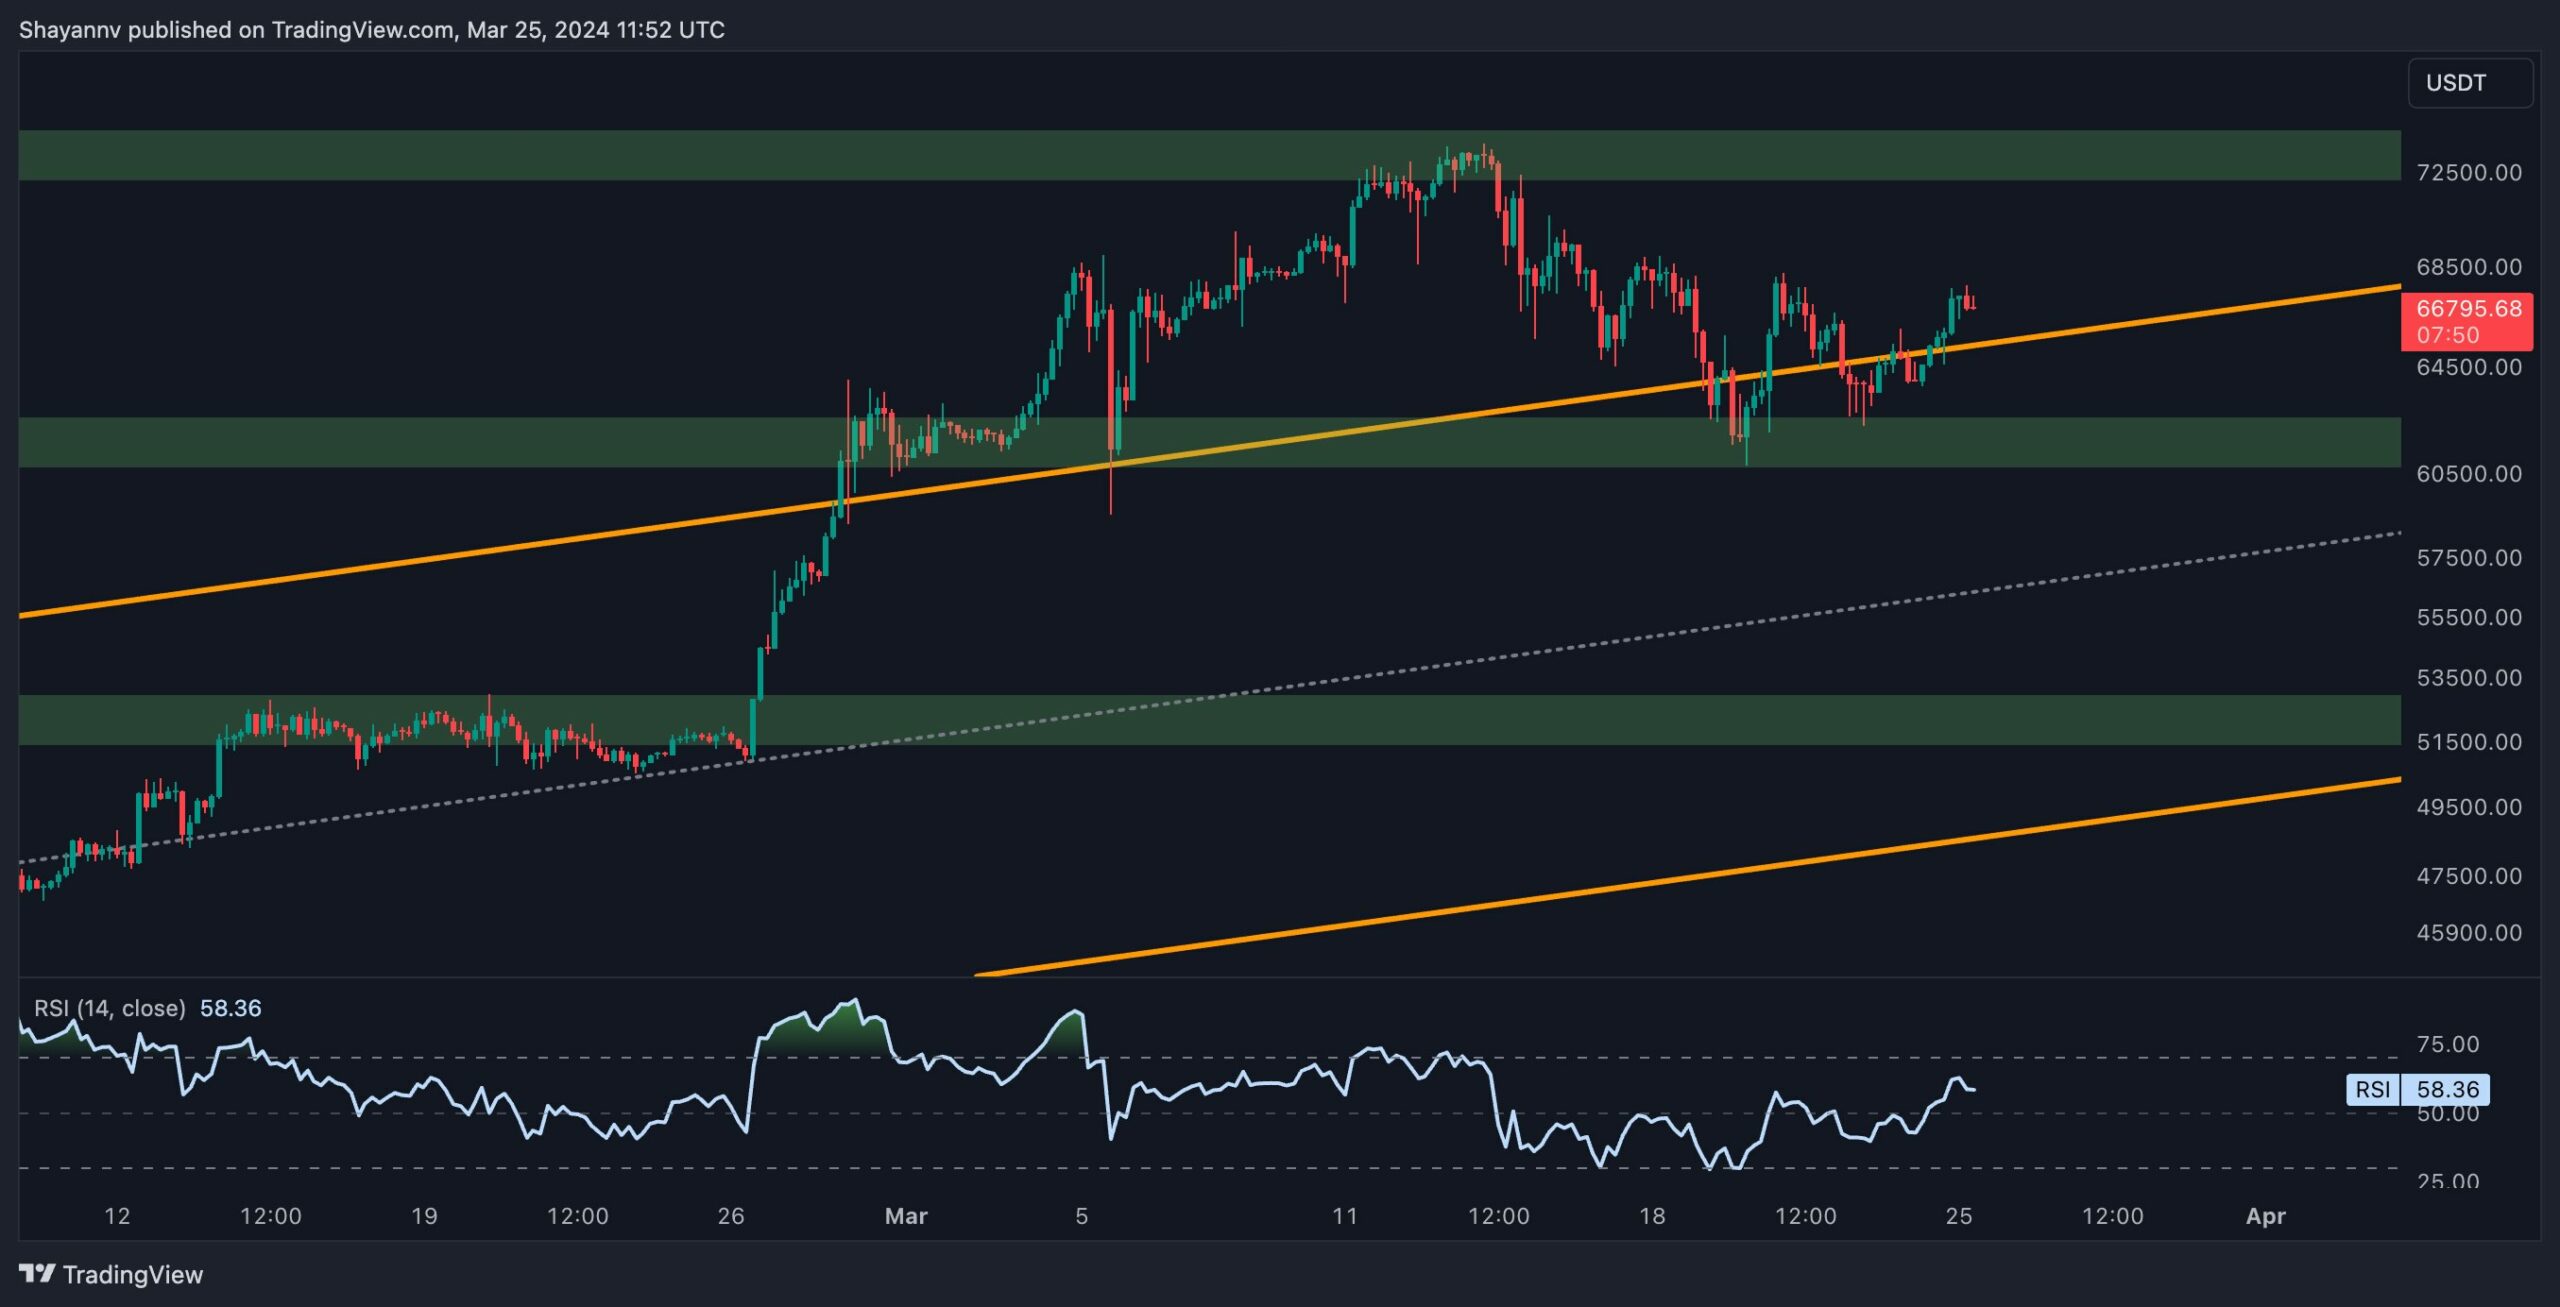
A closer examination of the 4-hour chart reveals a notable rejection near the $73K resistance region, leading to a multi-day decline towards a significant support region, which encompasses the $60.5K support level aligning with the dynamic support of the ascending channel’s upper boundary.
However, the price is displaying a sideways consolidation action after touching the channel’s upper trendline, introducing uncertainty into the market.
It’s important to note that the recent decline may stem from profit realization among market participants. Such behavior is typical during healthy bullish trends, allowing the market to rest and regain buying power. Consequently, Bitcoin is anticipated to resume its ascent towards the $73K threshold once the consolidation correction phase concludes.
On-chain Analysis
By Shayan
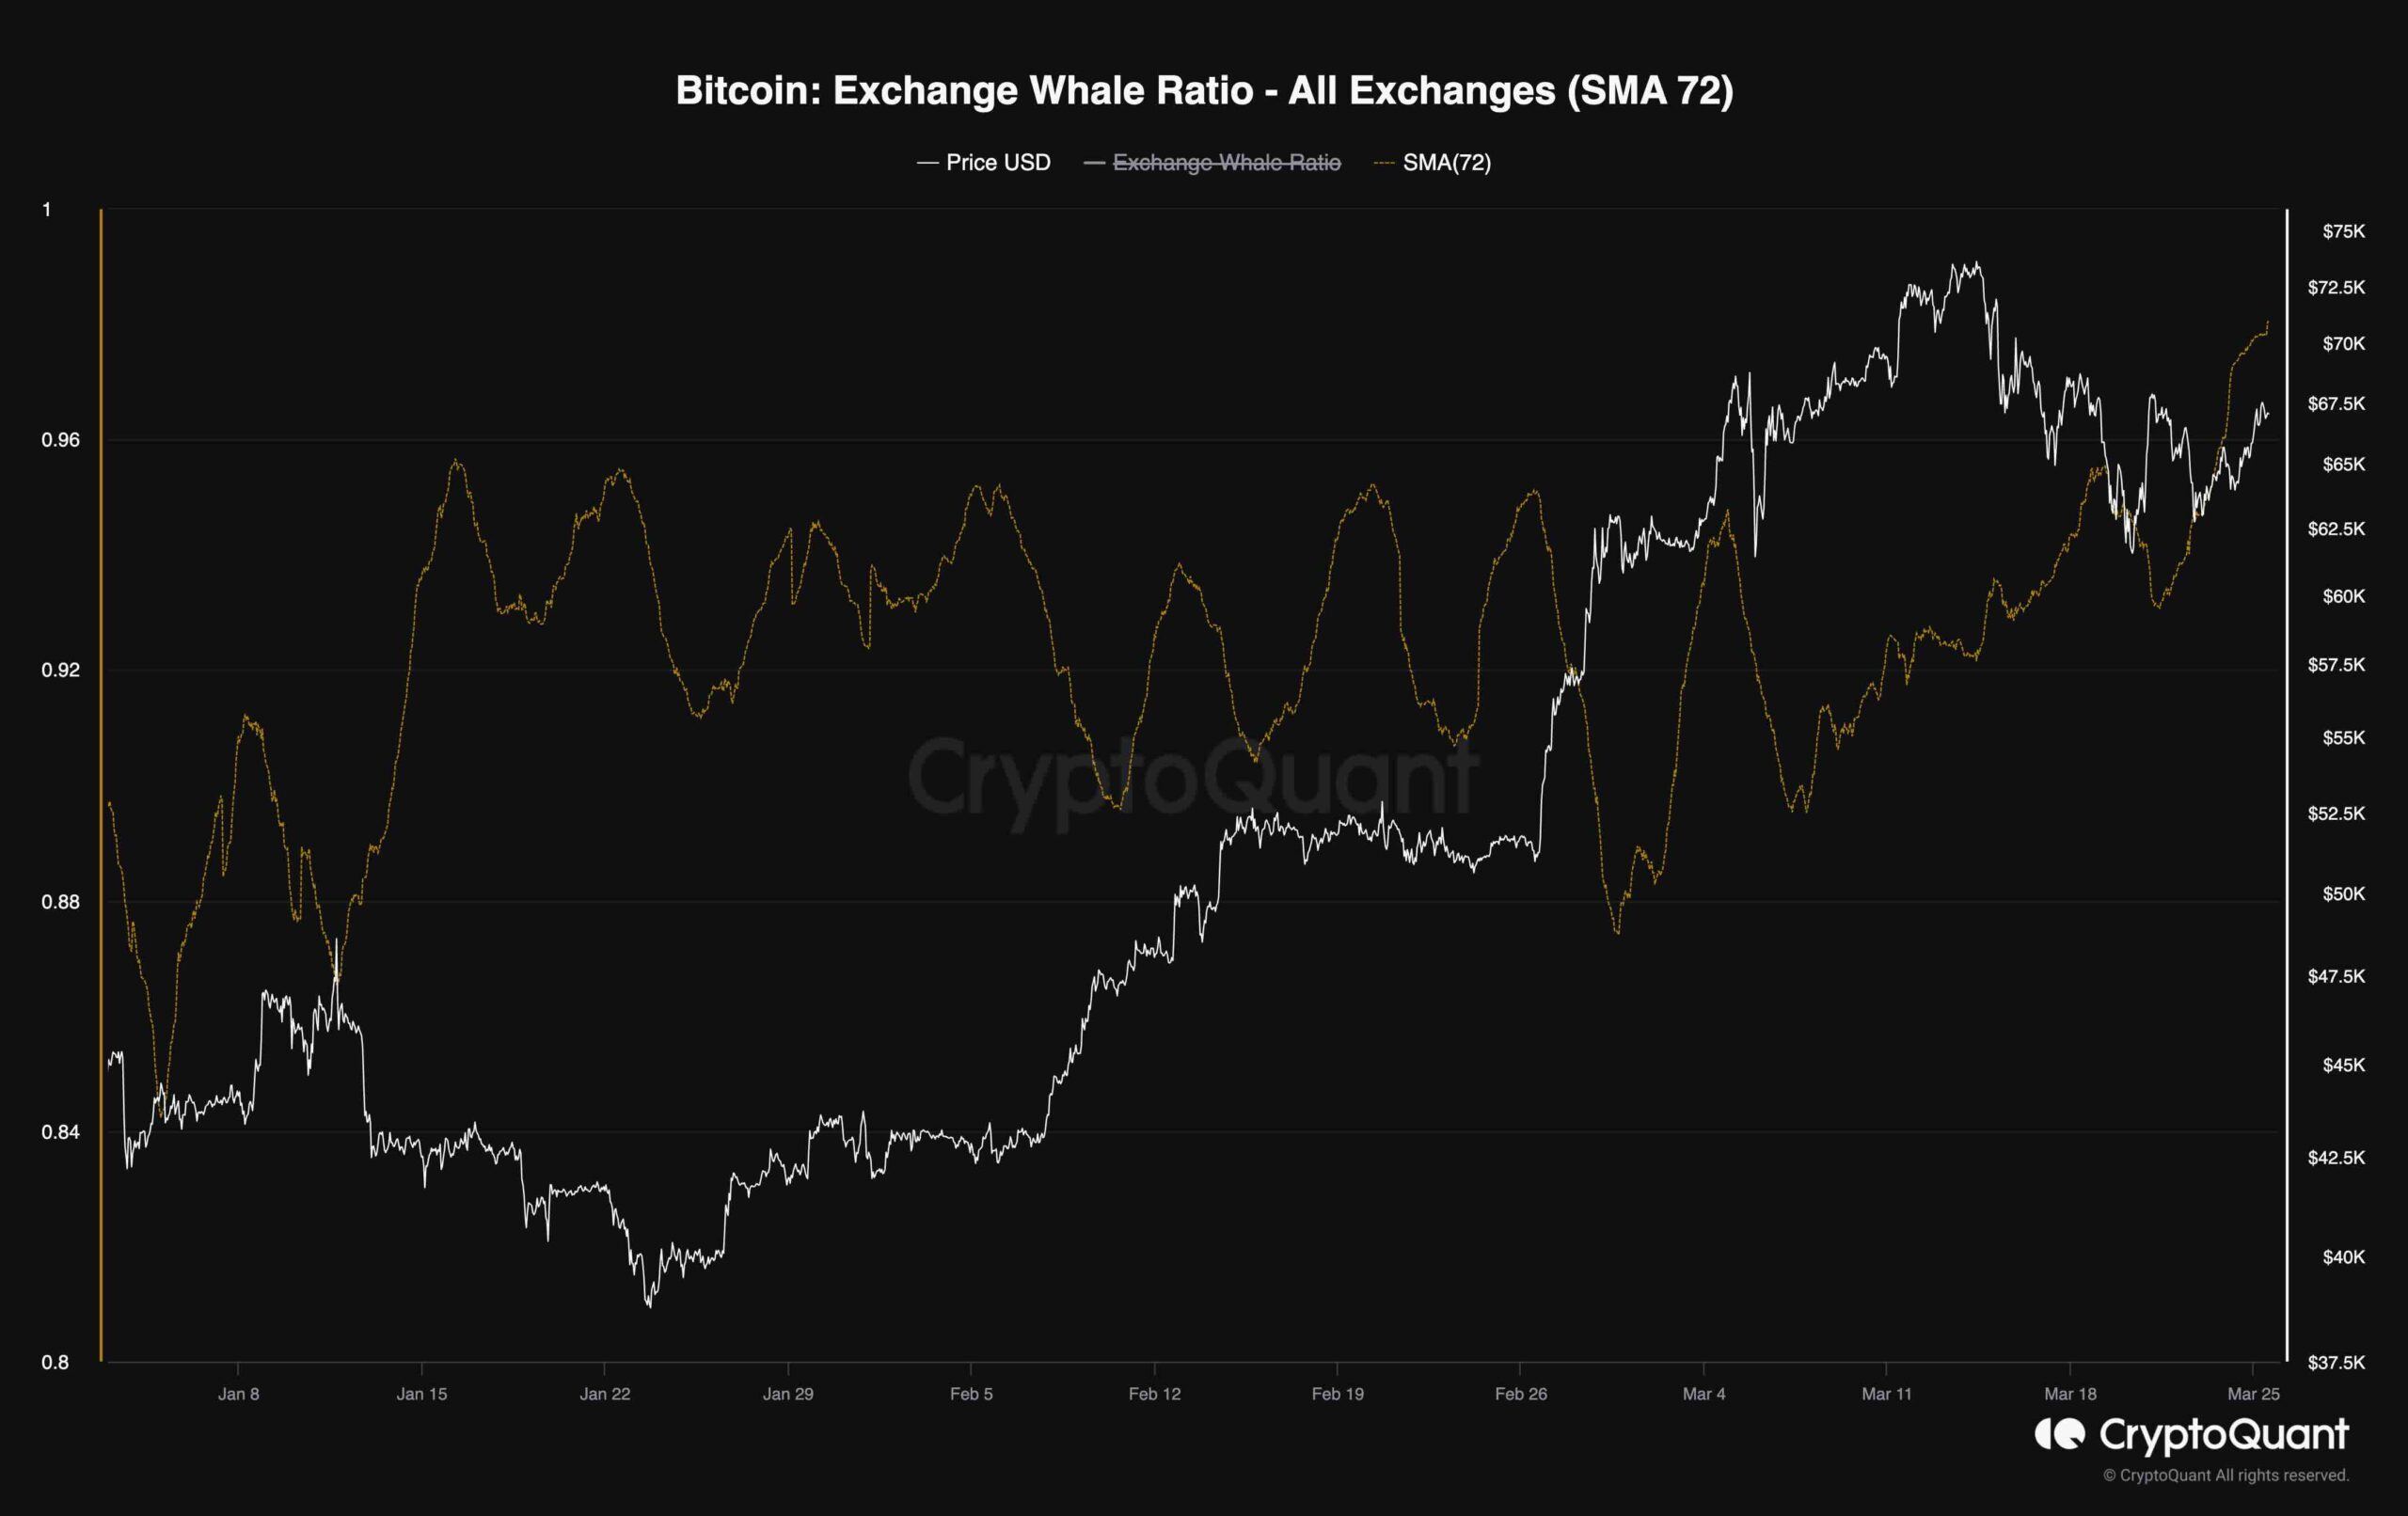
The “Exchange Whale Ratio” measures the ratio between the top 10 significant inflows and the total inflow volume on cryptocurrency exchanges. Elevated values of this metric indicate significant funds from prominent players, commonly referred to as “whales,” being transferred into exchanges.
Currently, the Exchange Whale Ratio has surged in conjunction with the price experiencing a period of sideways consolidation and uncertainty. However, after a notable increase in whale activity in the markets, a period of volatility typically ensues, followed by a short-term decline, leading to the formation of a local dip.
On an hourly basis, the whale ratio metric has once again reached its peak level. This development suggests potential increased volatility in Bitcoin, with a possible drop back to the $62K-$63K range, which previously acted as support. It should be mentioned that whales selling off amidst the rapid rise in BTC price will likely pave the way for a healthy correction.
Nevertheless, it is crucial to closely monitor this ratio, as changes in its patterns could potentially lead to fluctuations in Bitcoin’s price.