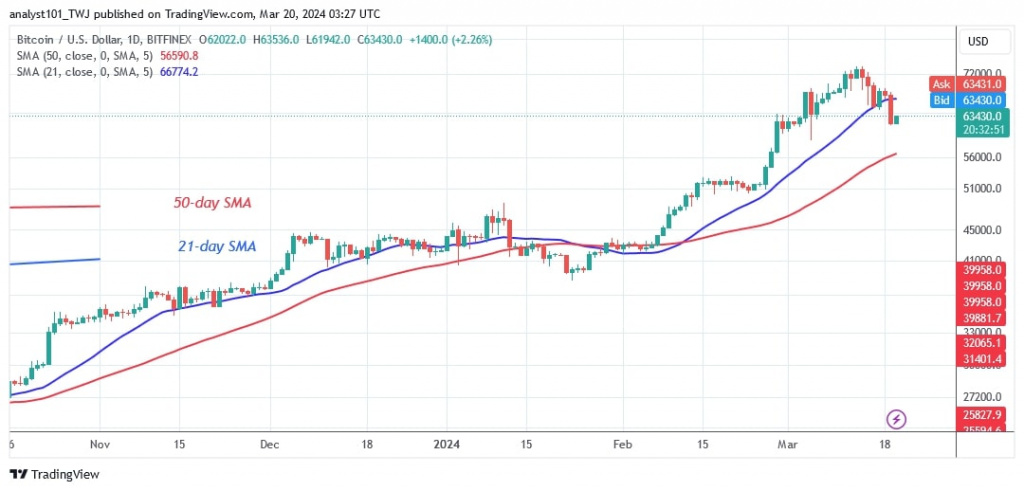
Nonetheless, the cryptocurrency value will continue to fluctuate as long as it remains between the moving average lines. Bitcoin will resume its positive trend if buyers keep the price above the 21-day SMA. Should the 50-day SMA support be broken, the price of the cryptocurrency will drop to $51,000 or even lower.
Bitcoin indicator reading
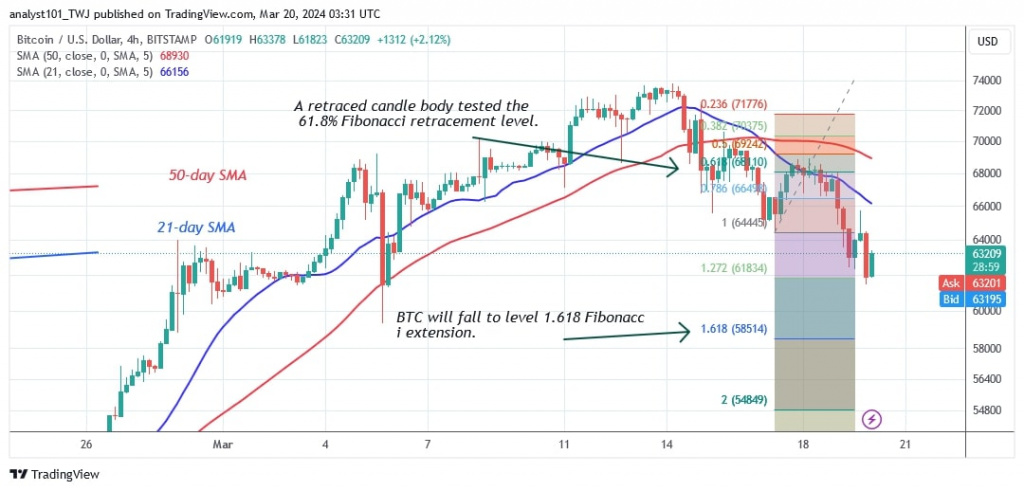
Bitcoin's recent rise ended when the bears broke below the 21-day SMA support. Since falling below the 21-day SMA support, Bitcoin has struggled to recover. It is currently trading below the 21-day SMA but above the 50-day SMA. Bitcoin's decline continues with the price bars holding below the moving average lines on the 4-hour chart.
Technical indicators:
Key resistance levels – $60,000 and $70,000
Key support levels – $50,000 and $40,000
What is the next direction for $BTC/USD?
Bitcoin has fallen as it faces a rejection of the $74,000 resistance level. During the decline on March 17, the $BTC price corrected upwards and the retraced candlestick body tested the 61.8% Fibonacci retracement level. The correction predicts that Bitcoin will fall below the 1.618 Fibonacci extension or the low of $58,514.
Disclaimer. This analysis and forecast are the personal opinions of the author and are not a recommendation to buy or sell cryptocurrency and should not be viewed as an endorsement by CoinIdol.com. Readers should do their research before investing in funds.

 coinidol.com