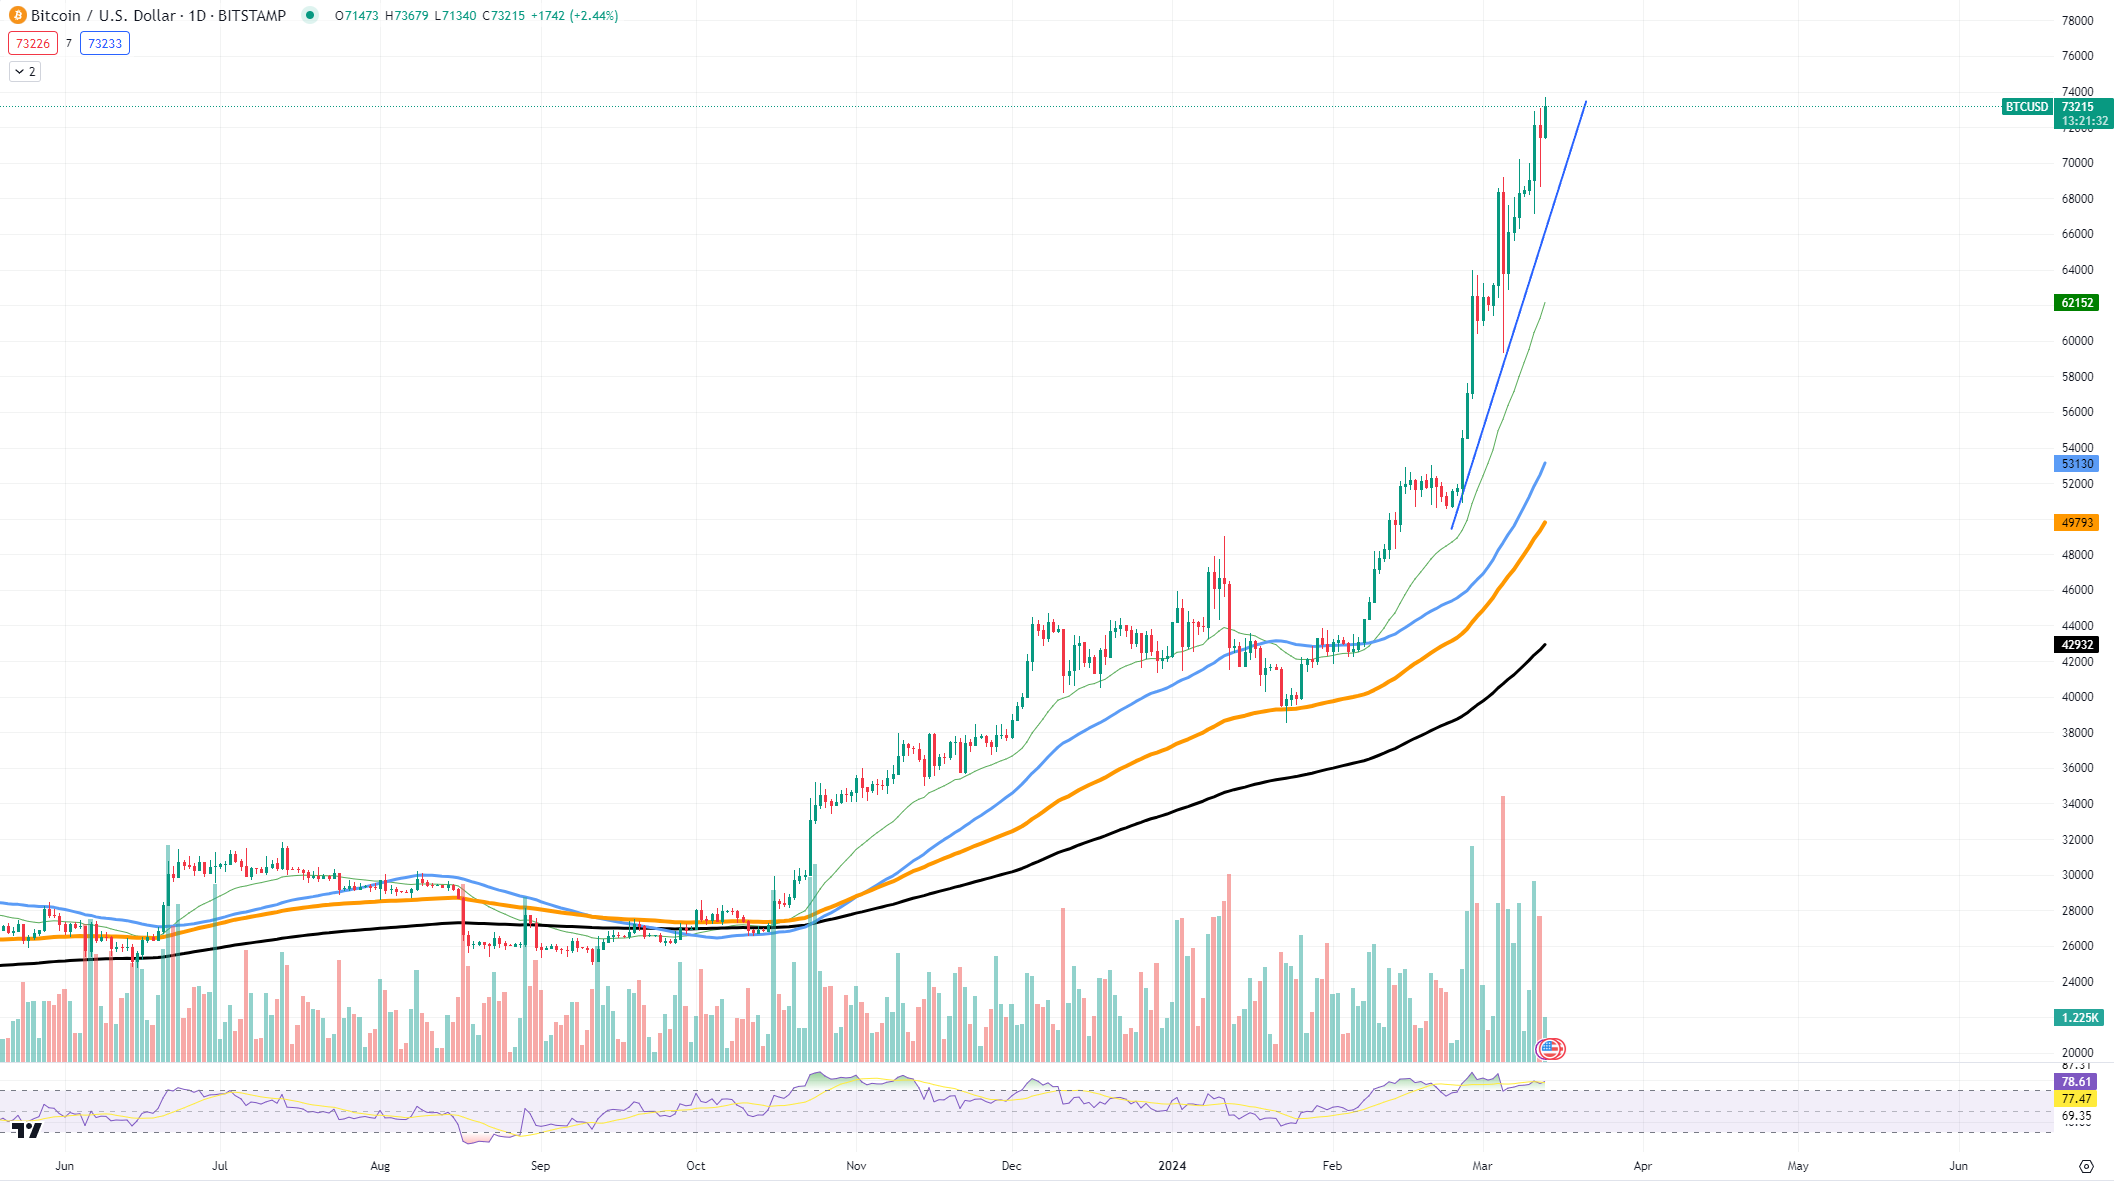
Upon examining the $BTC/USD price chart, we observe a steep and rapid ascent leading up to the recent high, a trajectory that was mirrored by a correspondingly sharp downturn. This pattern highlights Bitcoin's well-known volatility, which can be exhilarating for traders and harrowing for the unprepared.
The price action preceding the crash showed an almost vertical climb, a characteristic move during a FOMO-driven rally. This kind of movement is often unsustainable in the short term, leading to corrections, as we have witnessed. The rapid decrease can be partly attributed to profit-taking by early investors and the emotional reaction of newer market participants to sudden price changes.
Currently, Bitcoin faces a critical juncture. The $70,000 zone, previously acting as a psychological barrier, now serves as a resistance level that Bitcoin struggled to maintain. On the downside, support appears firm around the $65K area, marked by the confluence of the 50-day moving average and previous price consolidations.
The prediction for Bitcoin in the coming days is contingent on its response to these key levels. Should it reclaim and stabilize above $70,000, it could signal renewed bullish momentum, potentially setting the stage for another attempt at an all-time high.
Conversely, a failure to hold above the $65K support could see Bitcoin slide toward the next significant support near $60K, which aligns with historical price actions and the 100-day moving average.

 u.today