Bitcoin’s price has been making higher highs and lows consistently over the past few months. However, the market is currently consolidating around a key resistance level, failing to continue higher.
Technical Analysis
By TradingRage
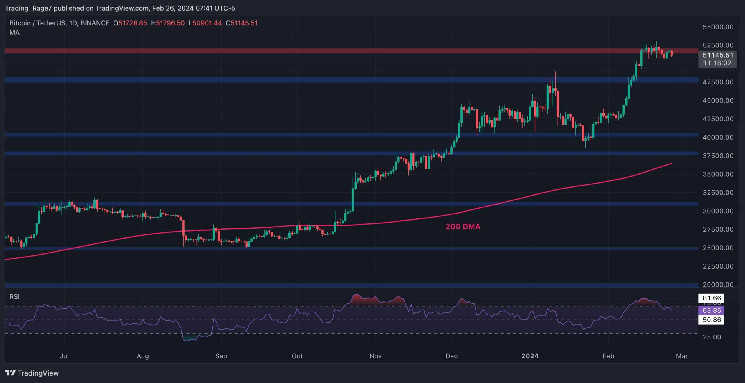
The Daily Chart
On the daily timeframe, the price has been breaking through several resistance levels since rebounding from the $40K support zone. Yet, the market is currently hovering around the $52K resistance level.
While there are no serious signs of climbing at the moment, the Relative Strength Index shows values above 50% that indicate higher prices might be achievable in the short term. Therefore, a breakout above the $52K resistance level is still probable.
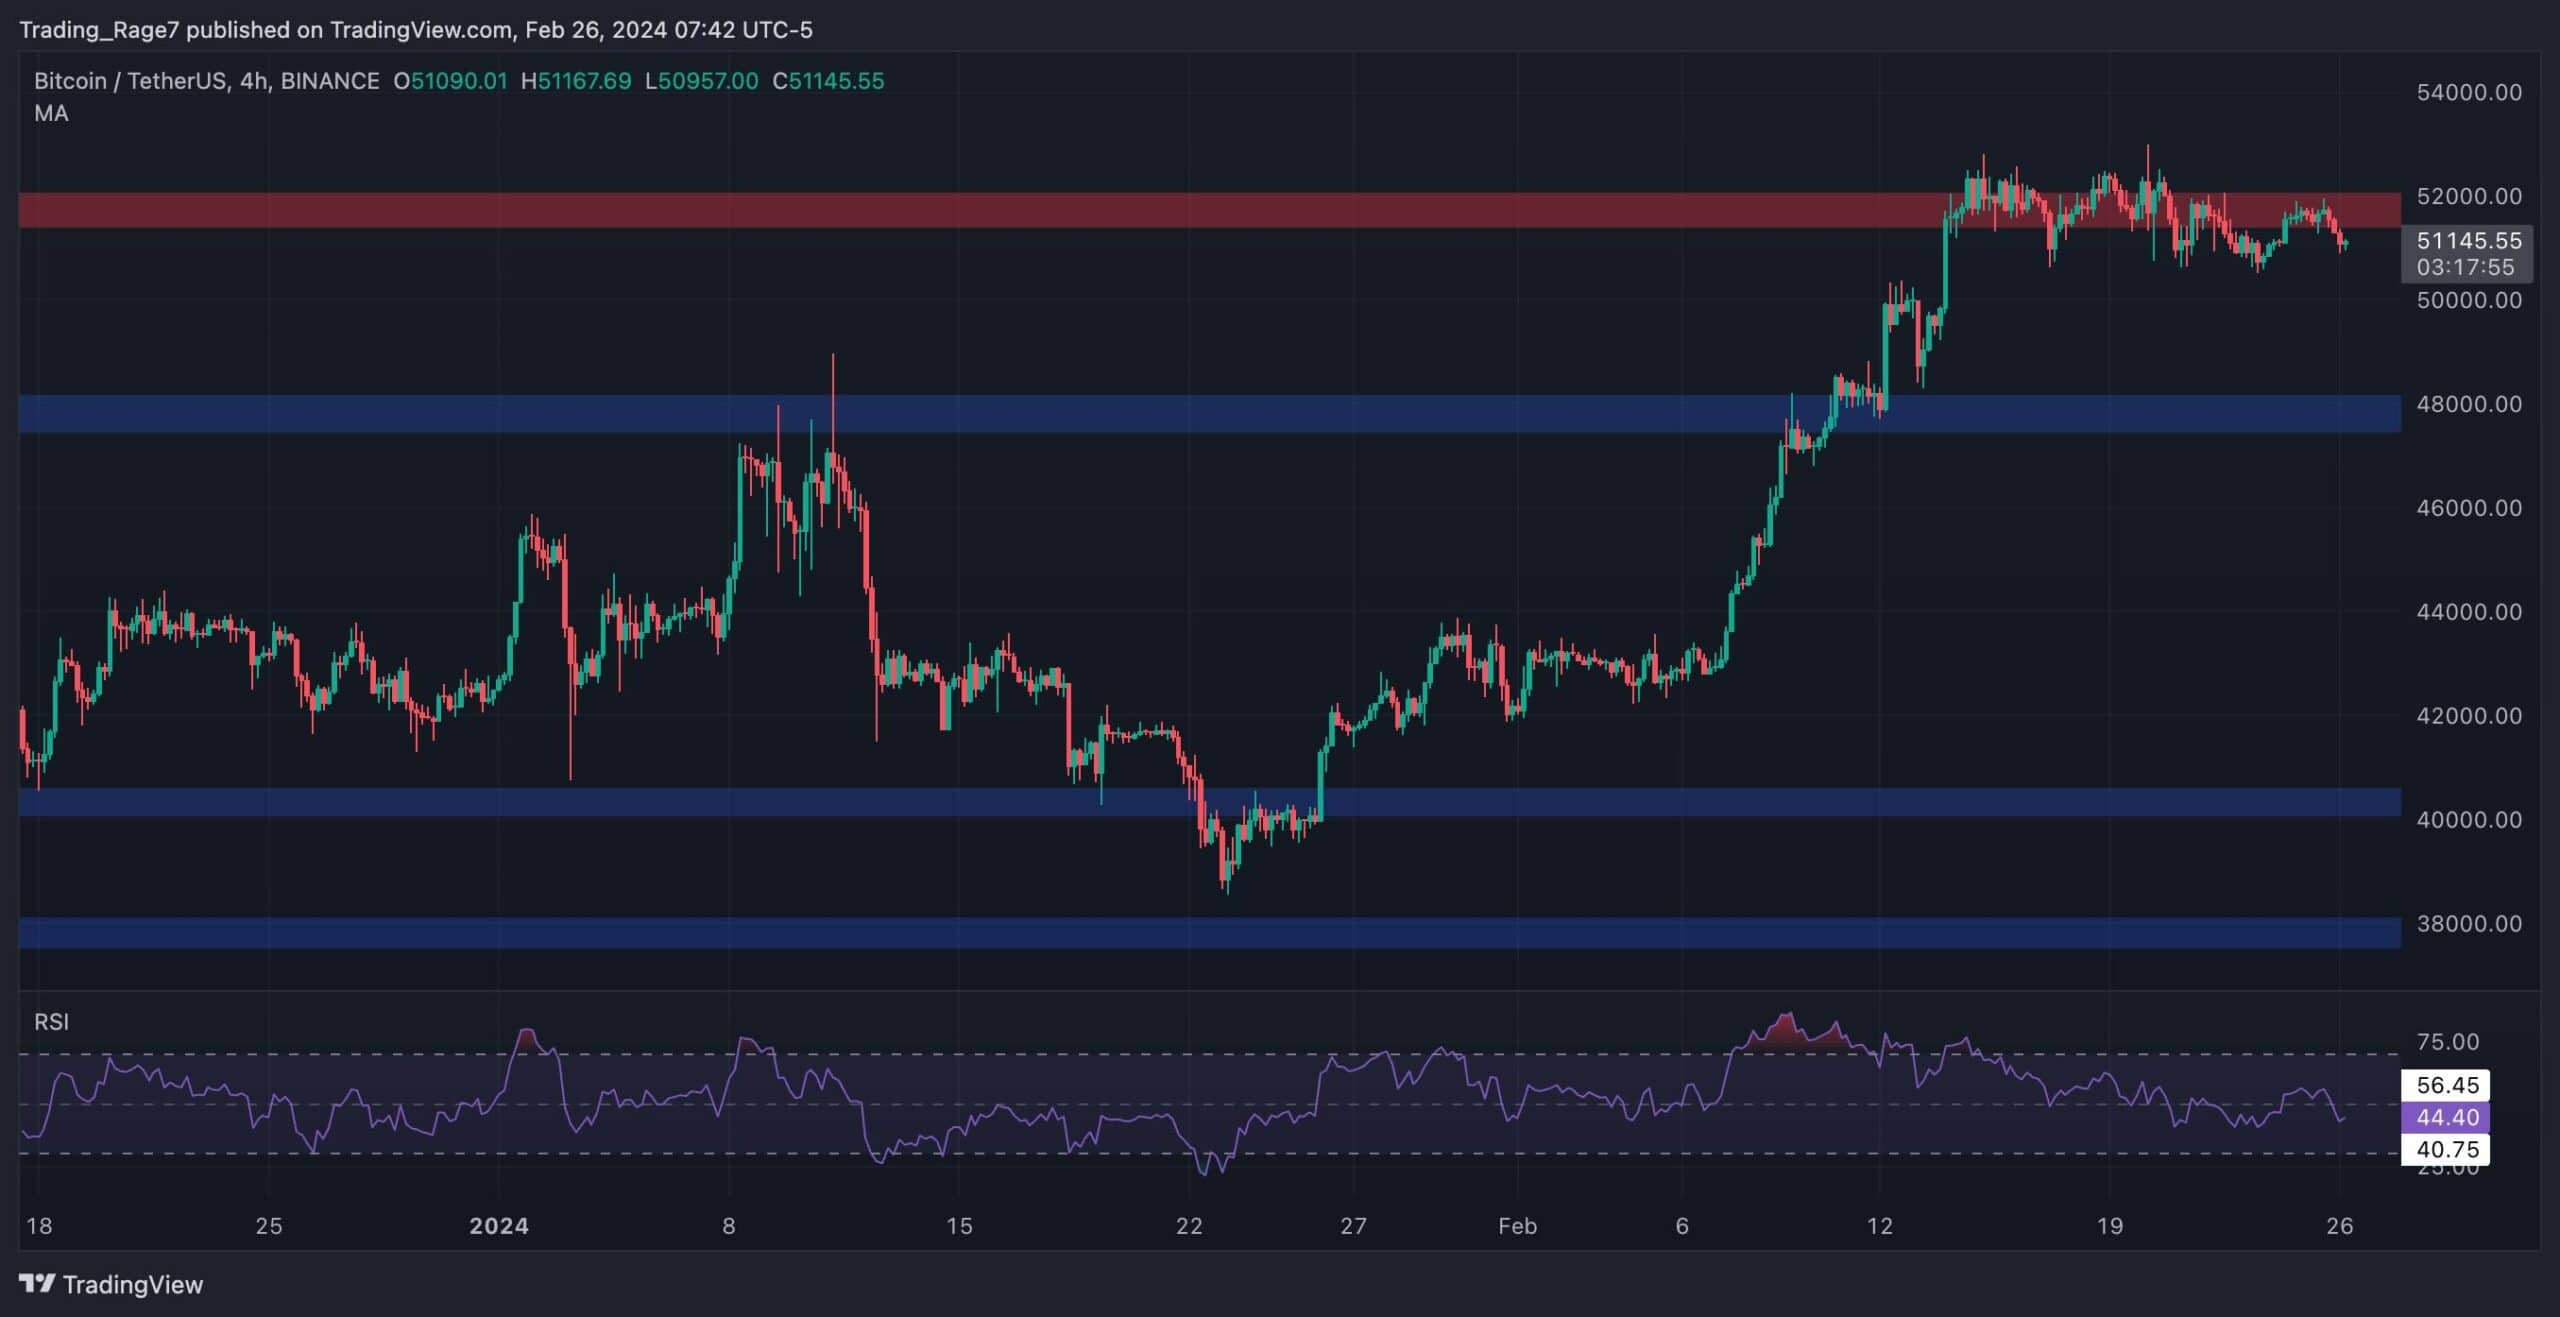
The 4-Hour Chart
Looking at the 4-hour chart, it is evident that the price has been consolidating around the $52K level over the last couple of weeks.
In case of a correction, Bitcoin might pull back toward the $48K support level before potentially continuing higher. The Relative Strength Index has also dropped below the 50% level, hinting at a potential correction in the near future.
On-Chain Analysis
By TradingRage
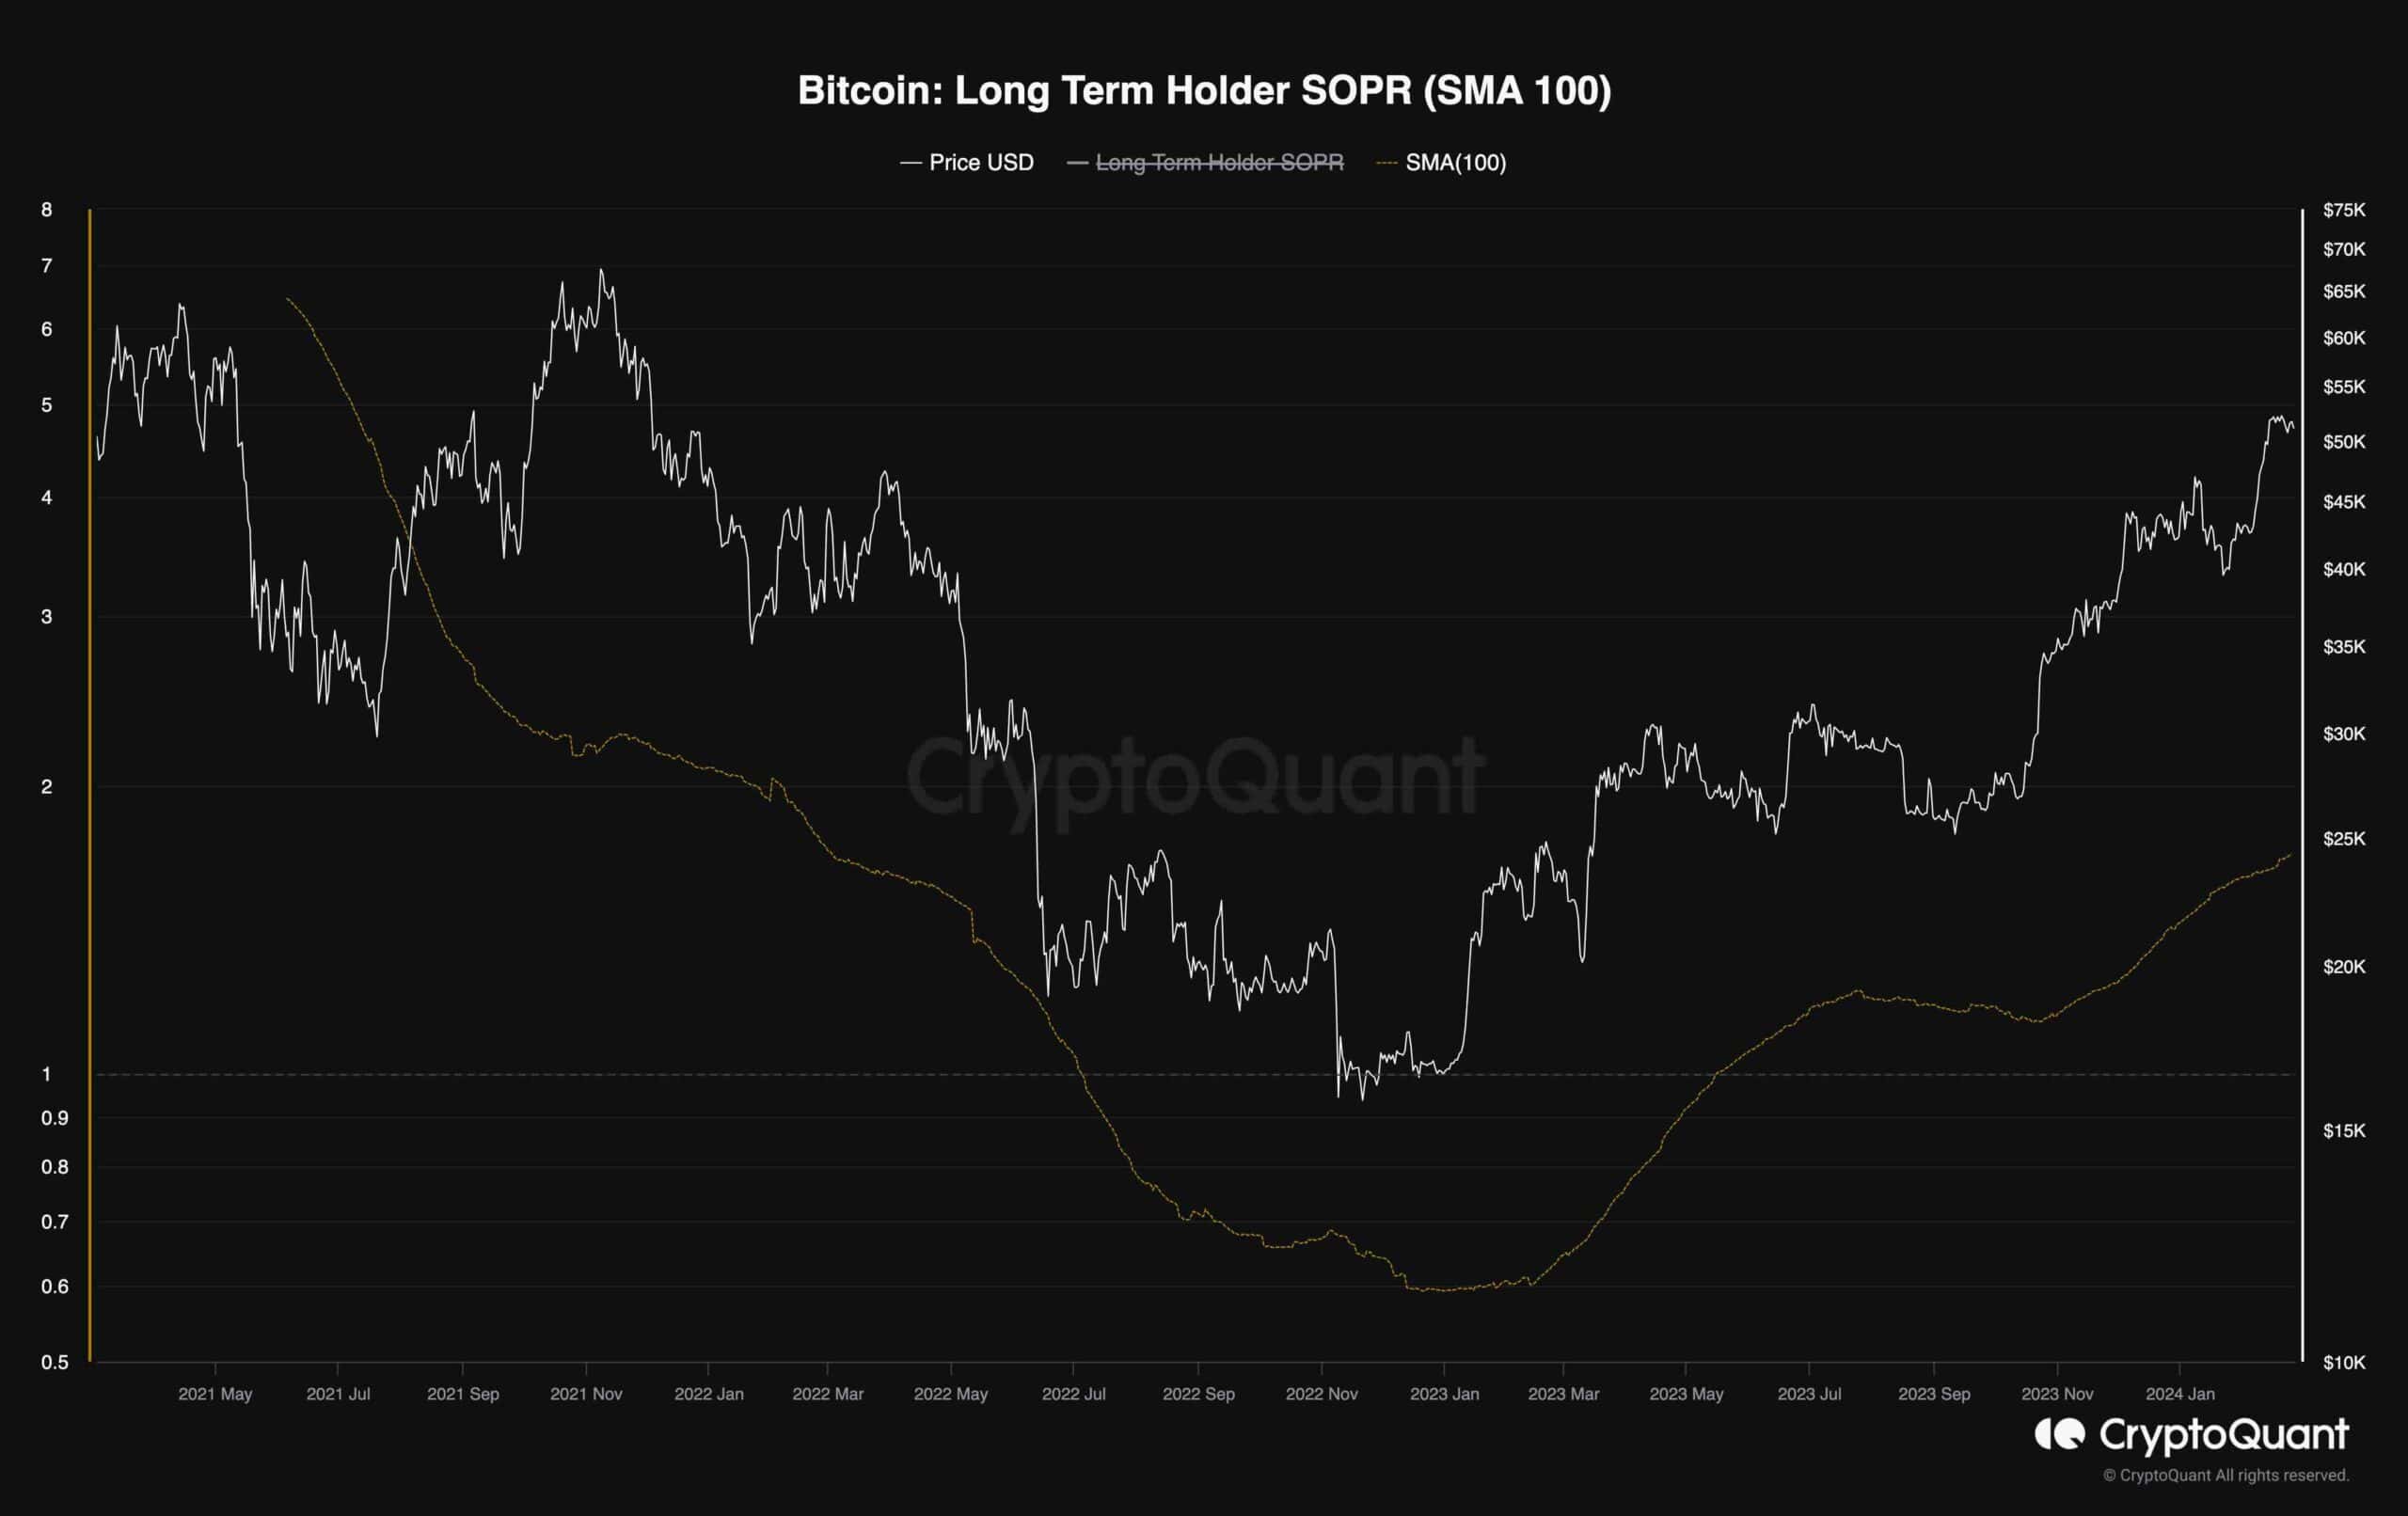
Bitcoin Long-Term Holder SOPR
Bitcoin’s price has been rallying aggressively over the past few months and is approaching its all-time high of $69K. It would be beneficial to evaluate market sentiment to analyze supply and demand dynamics.
This chart demonstrates the Bitcoin Long-Term Holder SOPR, which measures the relative profits realized by long-term holders. It is evident that while the price is about to approach its all-time high, the LTH SOPR is still far behind.
Therefore, it can be interpreted that long-term holders are being patient for higher prices. As a result, their lack of supply can drive the market higher in the coming months.