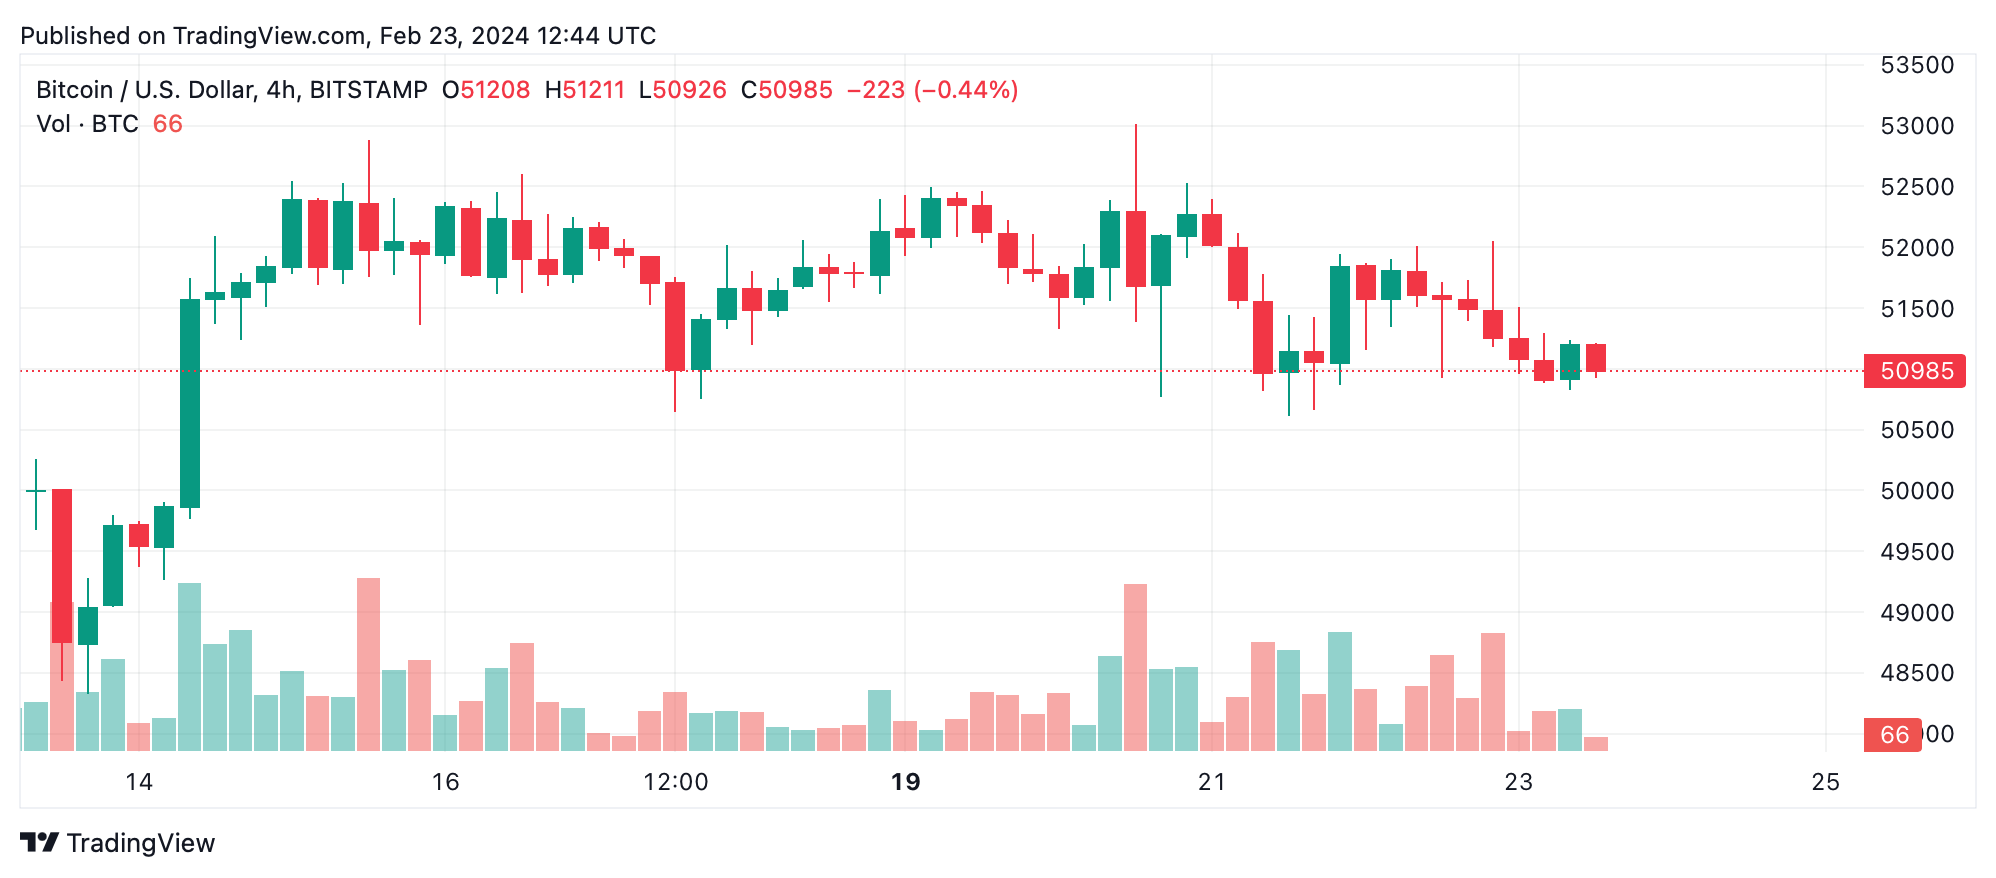
Bitcoin’s value on Friday added another page to its unfolding story, registering just under $51,000, showing a modest decline from its 24-hour peak of $51,965 down to a trough of $50,877. Despite this dip, bitcoin’s 24-hour trading volume remains at $25.07 billion, highlighting the crypto asset’s persistent market vigor. Additionally, the leading digital currency’s market cap continues to float above the trillion-dollar mark.
Bitcoin
Bitcoin’s (BTC) oscillators and moving averages (MAs) reveal a mixed sentiment within the market. Oscillators such as the relative strength index (RSI), Stochastic, and commodity channel index (CCI) currently hover in a neutral zone, suggesting a period of consolidation or indecision among traders.
However, the momentum indicator points toward a bullish sentiment, while the moving average convergence divergence (MACD) level suggests a potential sell-off, indicating a divided perspective on bitcoin’s immediate price direction. MAs paint a more optimistic picture for BTC, with the majority signaling the positive upward momentum should continue.
This includes the exponential moving averages (EMAs) and simple moving averages (SMAs) across various time frames, from 10-day to 200-day periods. Such a bullish consensus from the MAs could hint at underlying strength in bitcoin’s price trajectory, despite short-term fluctuations. Analyzing the daily chart, it’s evident that BTC has been on a general uptrend, despite encountering resistance around the $53,015 level.
This resistance marks a pivotal moment for BTC, as a breakthrough and sustained position above this threshold could herald the continuation of its bullish momentum. On the flip side, the charts point to a possible buy-in moment at $38,505, should the price dip to this notably low level, presenting an opportune moment for investors to make their move.

The 4-hour chart offers a closer look, revealing a short-term bearish trend characterized by successive lower highs and lower lows. This pattern advises caution among short-term bitcoin traders, who should be on the lookout for signs of a bullish reversal or a climb above the current trend of lower highs to identify a viable entry point.
Furthermore, the hourly chart accentuates the intense volatility surrounding BTC’s recent price activity, especially pertinent for day traders. With prices fluctuating widely in brief intervals, it opens the door for both aggressive and cautious trading strategies, depending on predicted short-term price actions.
Bull Verdict:
Based on the analysis, the bullish indicators, such as the positive momentum from MAs and sustained interest above significant support levels, suggest that bitcoin is primed for an upward trajectory. Traders might see this as a strategic point to engage, anticipating potential gains as the market signals strength and resilience in overcoming resistance levels.
Bear Verdict:
Conversely, the bearish perspective highlights the caution warranted by mixed oscillator readings and the short-term downtrend observed in the 4-hour chart. This suggests potential volatility and uncertainty in the immediate future, with the possibility of a downward correction if bitcoin fails to breach and sustain above key resistance points.
 news.bitcoin.com