Your move $BTC.”
Source: Dave the Wave/X
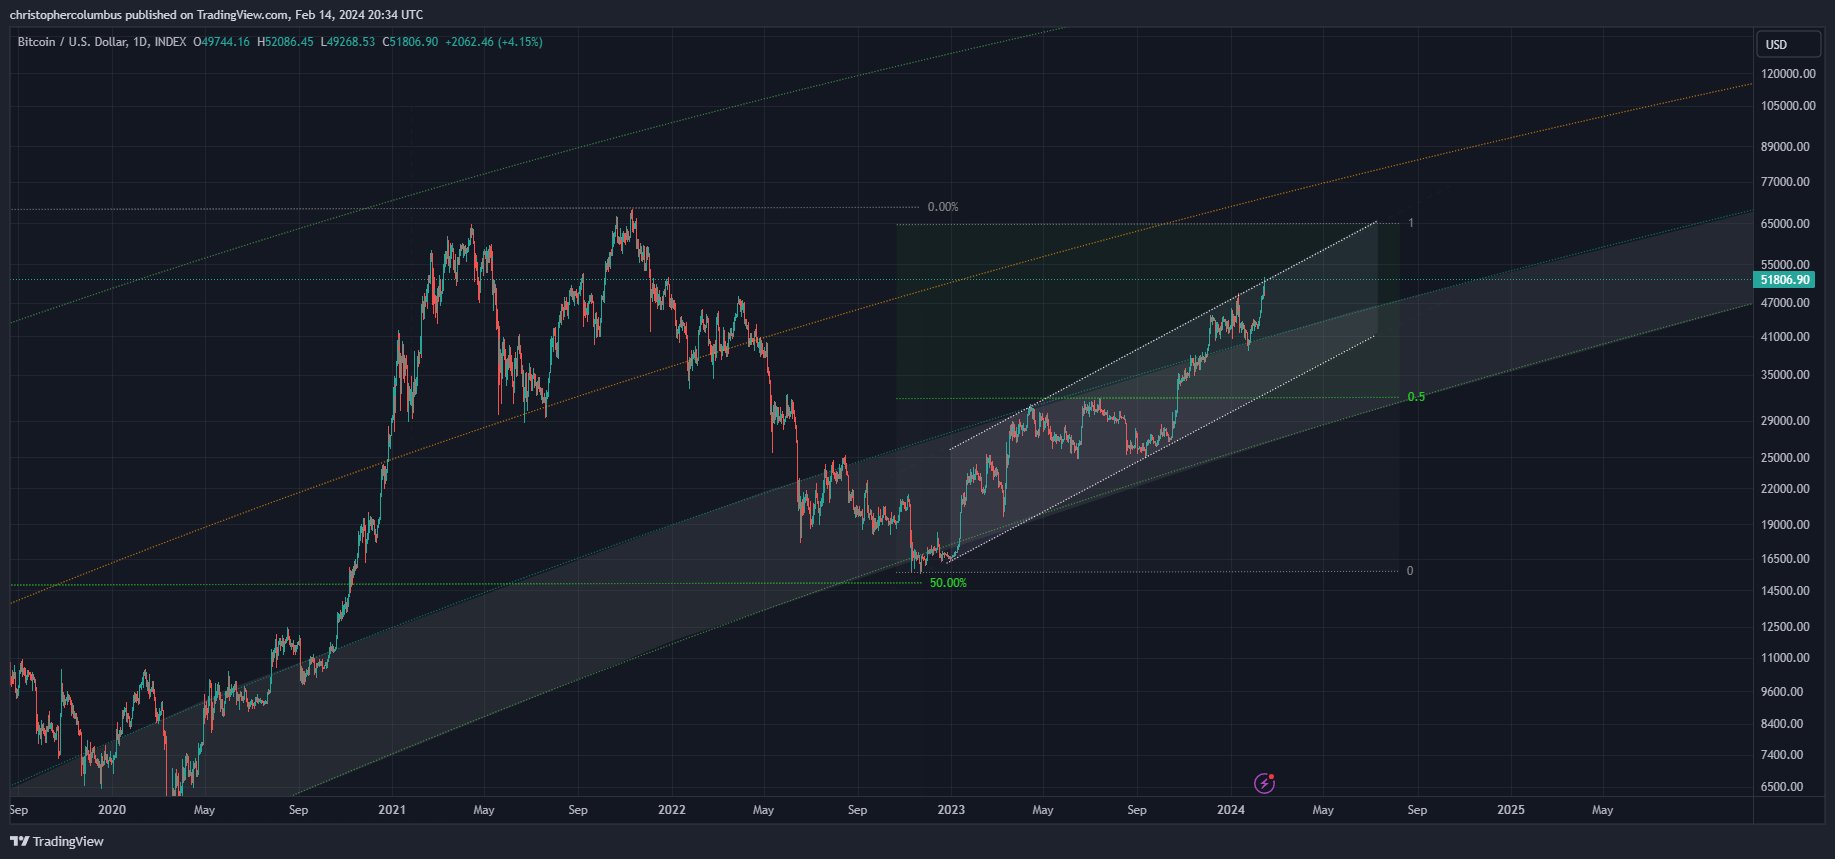
Looking at his chart, Dave the Wave thinks $BTC just broke out of a long-term regression band and is subsequently about to break out of a shorter-term overlapping ascending channel. If the breakout fails, the analyst’s downside target of $41,000 is at the bottom of the ascending channel.
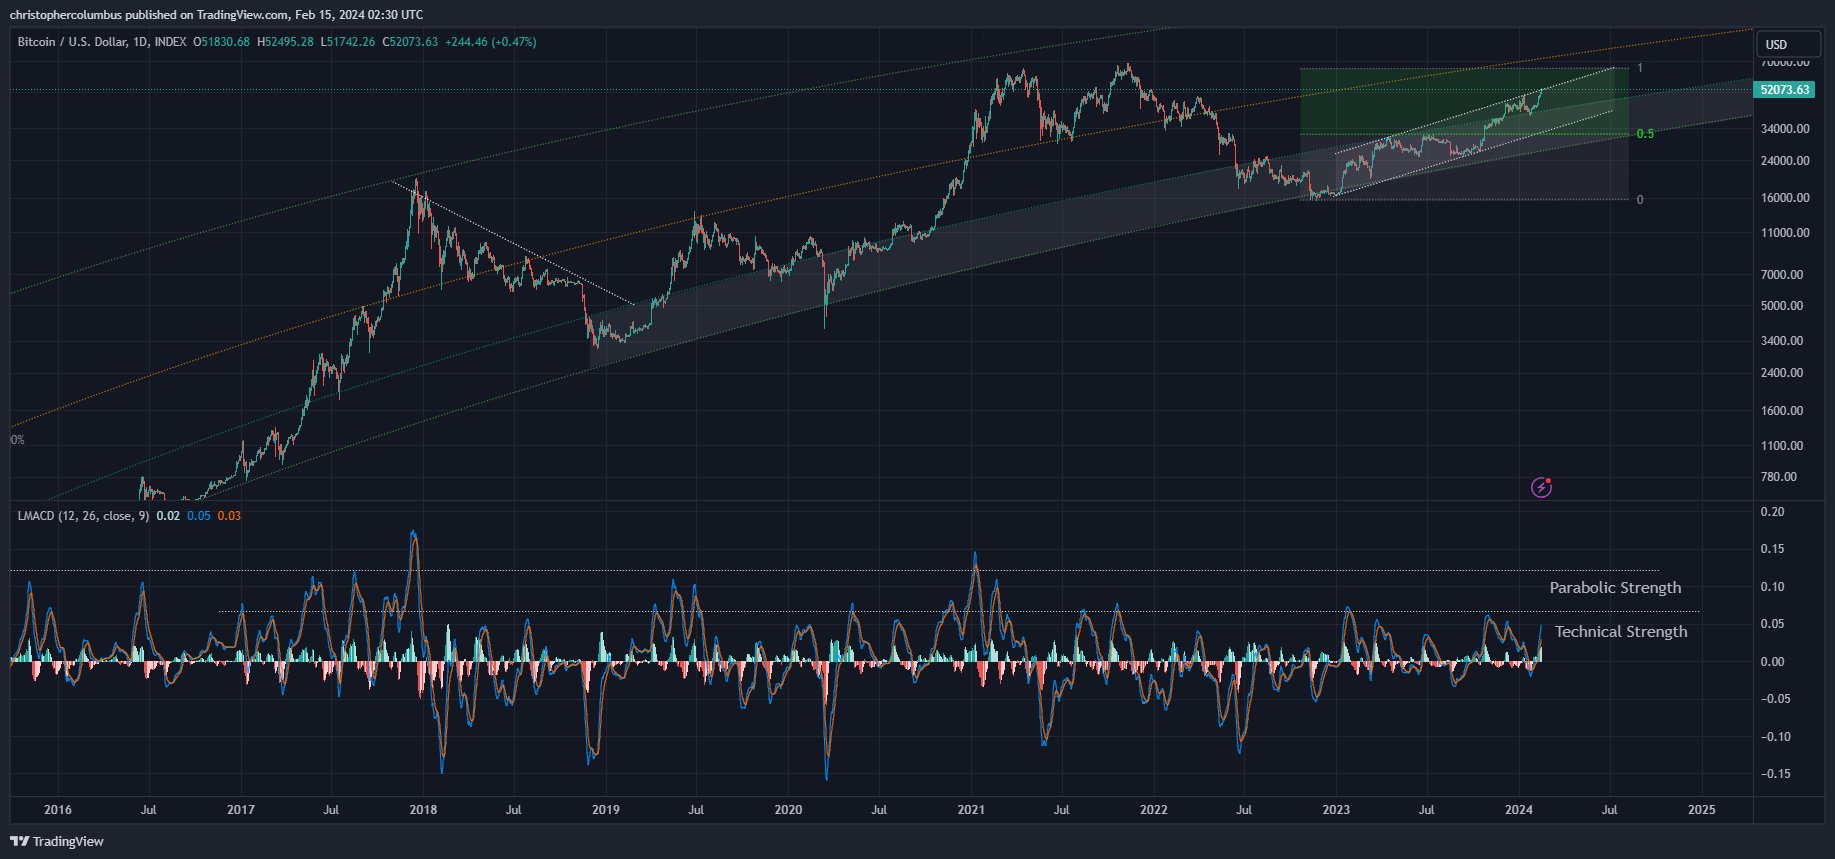
Dave the Wave says that Bitcoin’s moving average convergence divergence (MACD) could provide a clue as to whether or not $BTC could suddenly go parabolic.
The MACD is a momentum indicator that can suggest when trends are about to begin or reverse. According to the trader, once the MACD crosses above a certain level, $BTC explodes in a final upward impulse before exhausting itself, as it did in January 2021 and December 2017.
Currently, Bitcoin’s MACD is roughly a week away from potentially going into Dave the Wave’s “parabolic strength” zone.
“The daily $BTC MACD is a clue.
The difference between technical and parabolic strength.”
Source: Dave the Wave/X
At time of writing, Bitcoin is trading at $51,662.
Generated Image: DALLE3

 dailyhodl.com