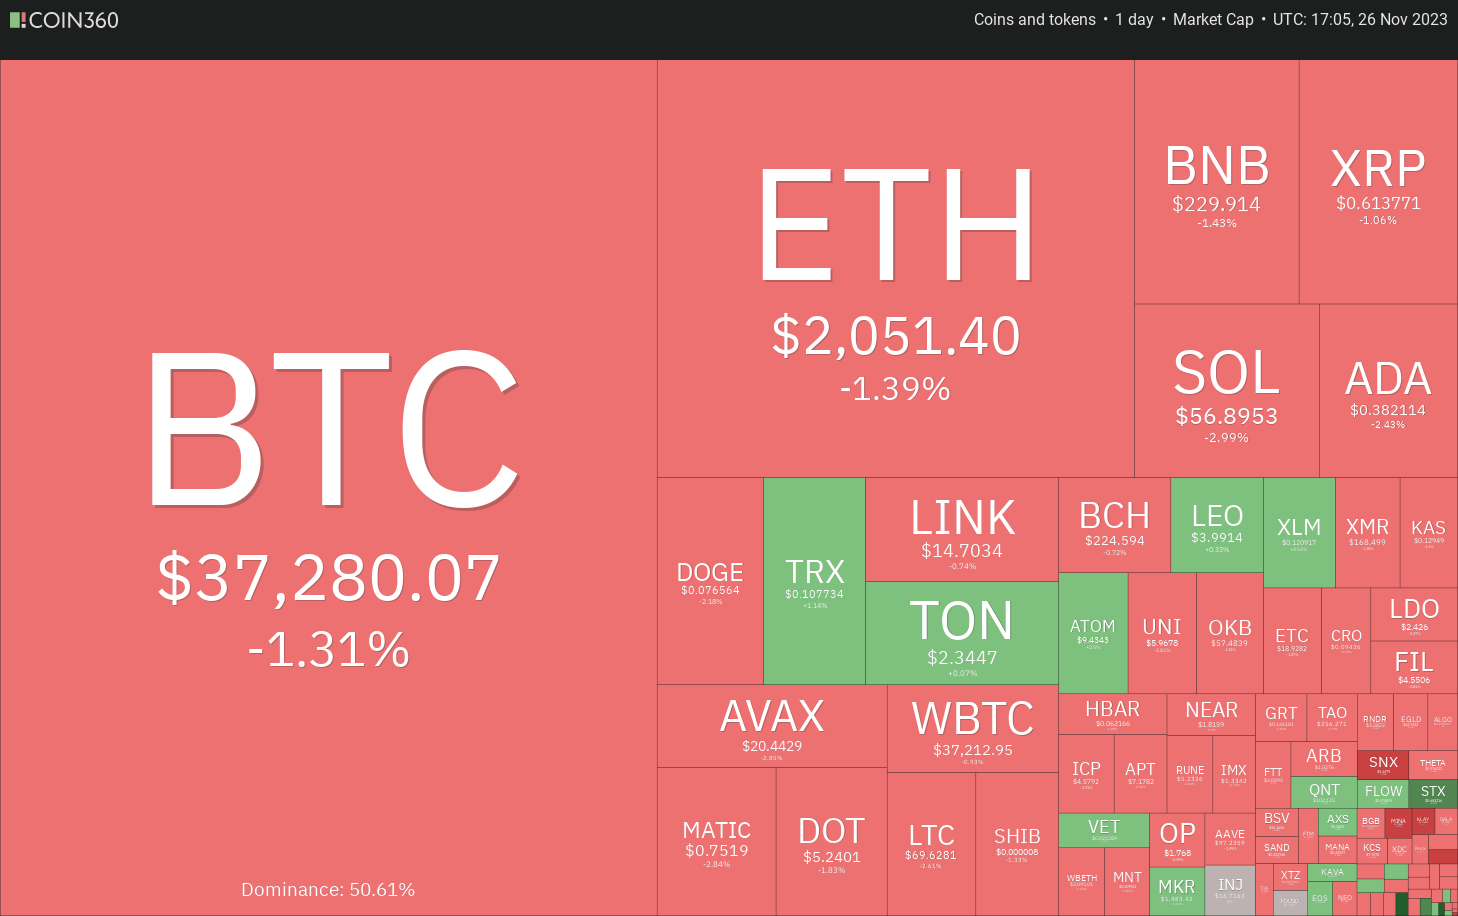
Bitcoin managed to break the closely watched $38,000 resistance on November 24th, but bulls failed to show a presence above this level. This development reveals that many investors are hesitant to buy at higher levels. On the weekly chart, Bitcoin is forming a Doji candlestick pattern for the second consecutive week. This indicates indecision among bulls and bears about the next move.
Notable Bitcoin Prediction from Analysts
As Bitcoin continues its movement near the highest level in 18 months, Arthur Hayes, the co-founder of crypto exchange BitMEX, maintains his bullish expectations. In a recent post, Hayes stated that US authorities are increasing dollar liquidity, which could trigger a rise in Bitcoin price.
Another bullish prediction came from PlanB, who shares his thoughts on Bitcoin price models. In a post, he claimed that Bitcoin will not stay at current levels for a long time. According to the analyst, Bitcoin will reach at least $100,000 between 2024 and 2028.
Analysts have become increasingly bullish in the past few days, but investors should proceed with caution as corrections are inevitable in the crypto market during every uptrend.

Bitcoin Chart Analysis
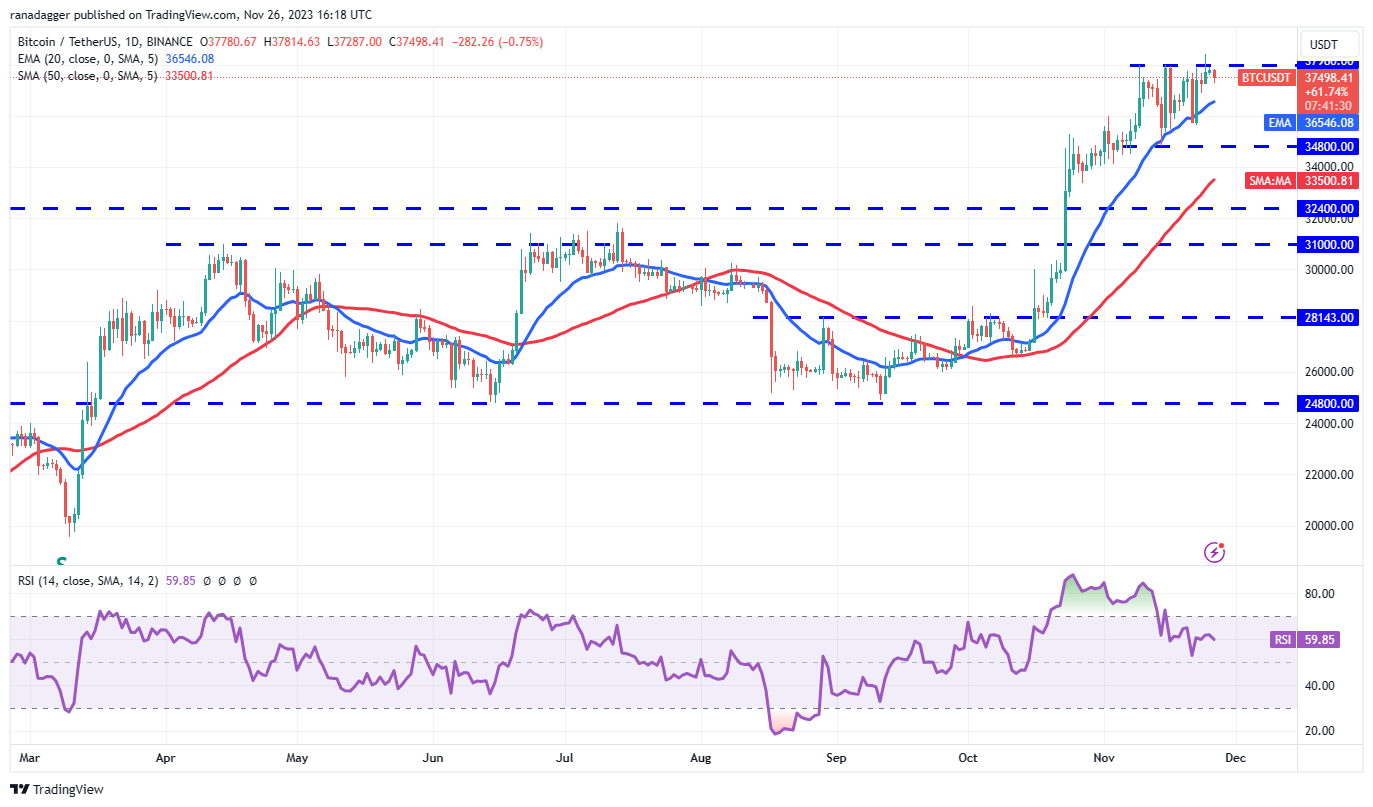
Bitcoin’s ongoing rally since October faced a hurdle at the $37,980 level, but investors are determined to close their positions. This indicates that investors are expecting the uptrend to continue further.
The immediate downside support is the 20-day exponential moving average, currently around $36,546. If the price bounces back from this support, it will signal that every minor correction is being bought. This will increase the likelihood of Bitcoin breaking above $37,980.
If this possibility materializes, the BTC/USDT pair could rise to $40,000. This level could be a strong resistance for investors, but if they manage to turn the $38,000 level into support, the uptrend could extend to $48,000. However, if the price falls below the 20-day EMA level, investors are likely to book profits.

