
Bitcoin (BTC) suffered a 2.82% drop over the past 24 hours, according to CoinMarketCap. Consequently, the cryptocurrency king was trading at $35,596.31 at press time. This strong correction may not be over yet, however, as technical indicators suggest that sellers may continue to exert pressure on the cryptocurrency’s price.
BTC was able to close a daily candle above $36,900 over the past few days but was unable to flip the level into support. Shortly after breaching the significant price point, traders engaged in profit taking, leading to the market leader’s price dropping back below this mark, where it continued to trade at press time.
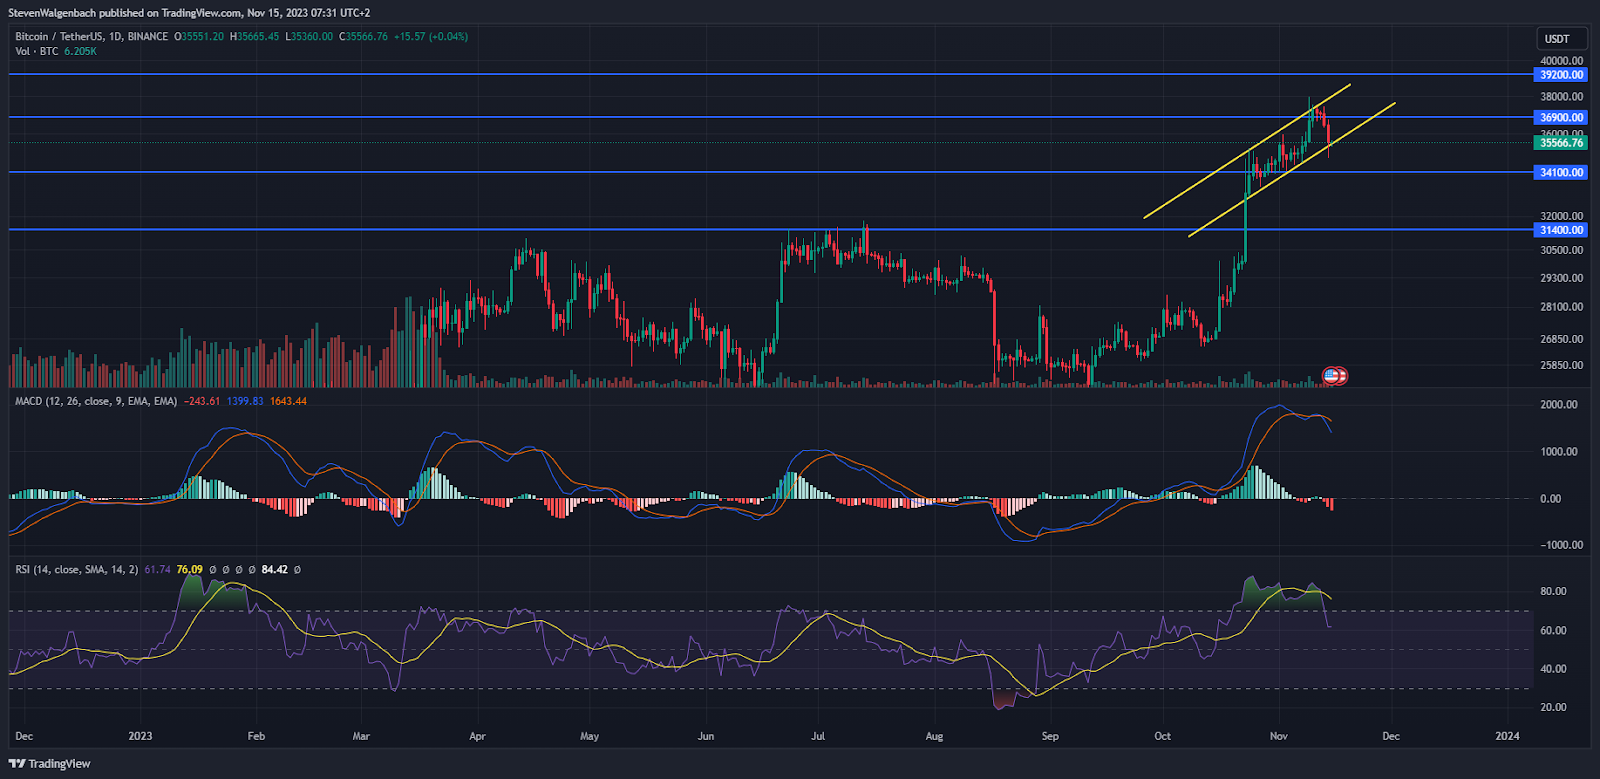
The wave of sell pressure also forced BTC below a medium-term positive price channel that had formed on its daily chart throughout the past 2 weeks. During yesterday’s trading session, the cryptocurrency reached a low of $34,800 before recovering slightly to close the trading session off at $35,551.19.
If BTC closes today’s daily candle below the ascending channel, then it may be at risk of testing the immediate support level at $34,100 in the following 24-48 hours. Thereafter, continued sell pressure could force BTC’s price below this point to the subsequent support level at $31,400 in the short term.
On the other hand, BTC closing today’s trading session within the positive channel could invalidate the bearish thesis. The leading cryptocurrency will then need to remain within this channel for the following 2 days before it can enter another leg up.
Traders and investors may want to wait for BTC to establish a position above $36,900 before entering into a long position for BTC. Forming a strong foundation above this major resistance level could then open up the opportunity for BTC to rise to $39,200 in the following few days.
Technical indicators did, however, suggest that BTC’s price may continue to drop in the next 24-48 hours. The Moving Average Convergence Divergence (MACD) line plummeted below the MACD Signal line over the past 3 days. This could signal that BTC’s bearish trend may not be over yet.
In addition to the MACD, the Relative Strength Index (RSI) indicator on BTC’s daily chart showed that bears were stronger than buyers at press time. This was after the RSI line broke below the RSI Simple Moving Average (SMA) line. Given BTC’s 32% gain over the past month, a healthy correction may be needed for it to continue to rise.
Disclaimer: The information presented in this article is for informational and educational purposes only. The article does not constitute financial advice or advice of any kind. Coin Edition is not responsible for any losses incurred as a result of the utilization of content, products, or services mentioned. Readers are advised to exercise caution before taking any action related to the company.