Since Bitcoin broke firmly above the $9K price line last Tuesday, we saw the coin consolidating mostly inside the range of $9300 – $9400.
The beautiful thing about Bitcoin is that its volatility will ever stay. It doesn’t really matter whether Bitcoin price is trading for $10, $100, or $9000.
Yesterday we saw another volatile move a-la Bitcoin: in under 30 minutes, we saw Bitcoin dropping from $9450 to $9000, only to mark a new yearly high at $9570 not so long after.
The day traders who had kept their positions with stop-loss commands in that region were very unhappy to find their position liquidated in loss following this mini flash-crush.
As a reminder, the $9550 was mentioned by us on the previous price analysis as the next level of resistance above $9400.
Bullish, But Be Careful
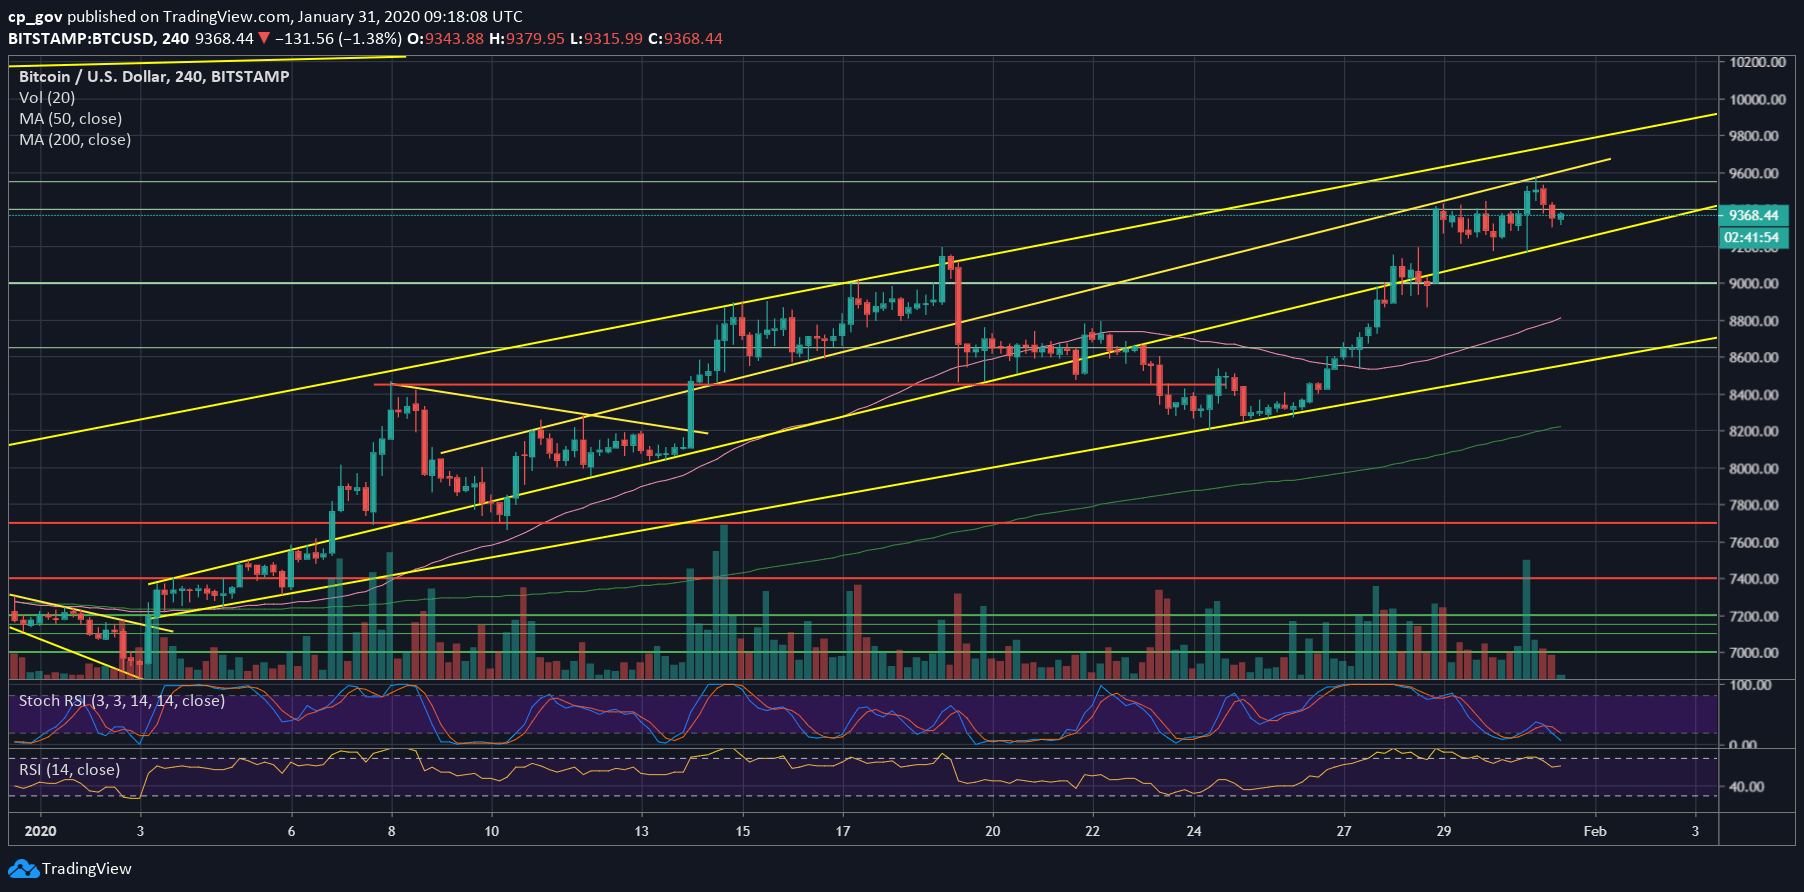
Bitcoin’s recent price action is respecting the ascending channel on the 4-hour chart below. As can be seen, yesterday’s low of $9170 (Bitstamp) reached down precisely to the supporting line.
The overall picture is bullish; however, some signs suggest that Bitcoin might need to visit lower areas in the short-term, before continuation further above.
Total Market Cap: $258 billion
Bitcoin Market Cap: $170 billion
BTC Dominance Index: 66.0%
*Data by CoinGecko
Key Levels To Watch & Next Targets
– Support/Resistance levels: Bitcoin is now back at the confluence zone between $9300 – $9400. The first level of resistance lies at the yearly high at around $9550.
Further above lies the resistance area of $9700 – $9800, which includes the top boundary of our marked ascending price channel (marked on the following 4-hour chart). Higher above lies $10,000 and $10,300.
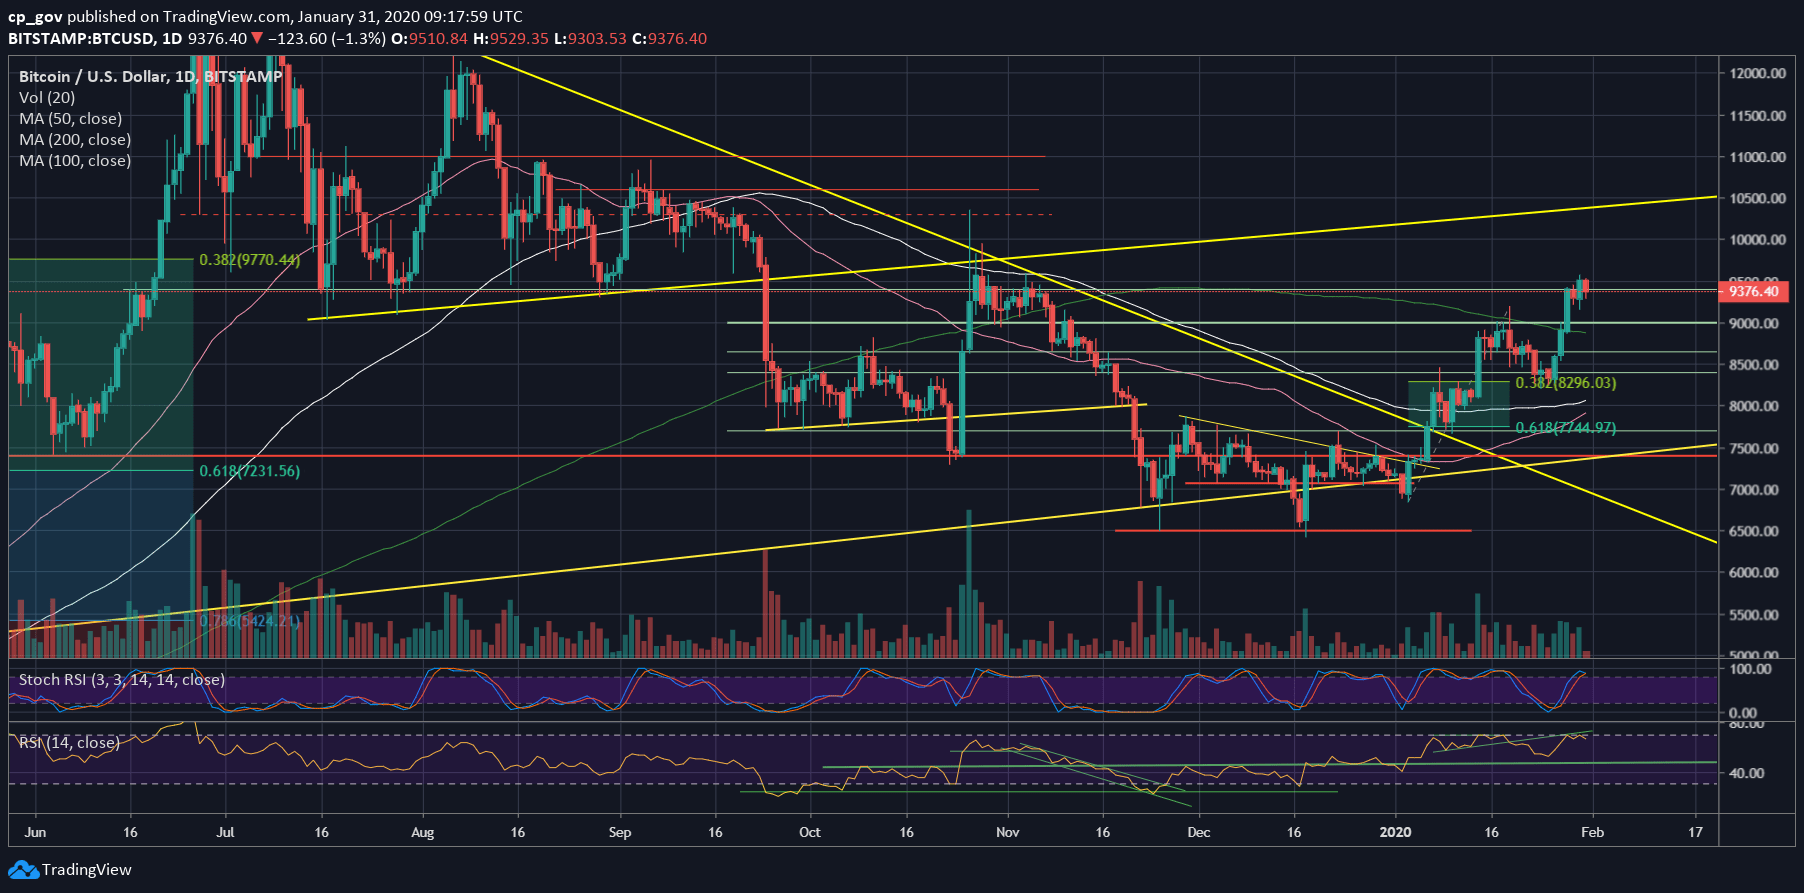
In the likely event of a correction, then the first level of support is the marked ascending trend-line on the 4-hour line (~$9280). Down below lies $9200 before the $9000 benchmark. Further down lies the significant 200-days moving average line, roughly around $8850.
– The RSI Indicator: As mentioned in the previous price analysis, the momentum indicator had failed to breach the short-term ascending trend-line, together with the 71-72 RSI levels. This had resulted in a bearish divergence that supports the idea of a possible correction.
Besides, the Stochastic RSI oscillator is about to make a bearish crossover at the overbought area. This also supports the correction option in case the crossover is made.
– Trading volume: The volume levels had started to increase over the past days, which is a bullish sign supporting the longer-term bullish trend.
BTC/USD BitStamp 4-Hour Chart
BTC/USD BitStamp 1-Day Chart